Here’s a quick post that is a bit of a precursor to some of my more in-depth performance analysis articles that will be coming out in the future. One of my automation systems takes a bit over an hour to run. There are a lot of people I know that need to squeeze performance out of their systems and immediately look to their calc scripts. Yes, calc time can be a large part of your downtime, as can data loads, reports, and other activities. But I always stress that it is useful and important to understand your systems in their entirety.
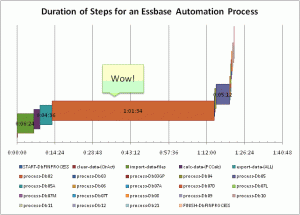
As part of looking at the bigger picture, I put together the following graph showing each step and how long it takes in this system that takes around an hour. It’s not hard to tell that the majority of the time that it takes to run this job (the brownish bar that takes about an hour) is in one task! And what is that task? It’s a bunch of report scripts running on a staging database. This is clearly an obvious place for me to look at ways of saving time.
The staging database is is a rather clever cube that is essentially used to scrub, aggregate, and associate raw account level data to some more meaningful dimensional combinations for all of the other databases. Data comes in, it’s calculated, and it outputs a bunch of report scripts. Fundamentally, the reason that this approach takes so much time is that there are two highly sparse dimension combinations with tens of thousands of members each, and the report script writer has to go through a ton of on-disk data in order to figure out what to write. I could spend some time trying to optimize this process, in fact, I could probably play with some settings and get at least 20% improvement right now.
But, this is one of those times where it pays to stand back and look at what we’re trying to accomplish. As it turns out, I actually have all of the infrastructure I need to accomplish this task, but it’s in a SQL database. And, the task that is being performed is actually much more conducive to the way that a relational database works. I’m still putting the finishing touches on this process, but it’s mostly complete as of right now, and the performance is amazing. I can pump through the same amount of data in mere minutes now, with no loss of functionality.
My specific goal is to get this process that takes an hour or longer, to run in less than five minutes. I chose this instead of “as fast as possible” because I wanted something concrete and attainable. (My secret goal, just for kicks, is to get this all to run in under a minute). Once the automation for the SQL staging is all in place, I will be going through all of the individual databases and tweaking any and all settings in order to shave their downtime as well.
Historically, not a lot of effort has gone into extensive profiling on these cubes, so as nerdy as it sounds, I’m actually very interested to see where else I can shave a few seconds off. At first this will undoubtedly involve using more write threads in the dataload, rewriting the calc scripts to tighten them up from just their current CALC ALL, aligning the order of the data fields and rows with the dense/sparse-ness of the outlines and the outline order, choosing better cache settings that are customized for the size of the index and page files, and perhaps looking at benefits of zlib compression (theoretically more CPU time to compress/decompress, however, generally the CPUs on these servers are not slammed very hard, so if I can get the size of the physical page files down, I may be able to read it into memory faster).
So remember — you spend a lot of time doing calculations, but that might not alway be where the low hanging fruit is. I cannot stress enough the importance of understanding where you spend your time, and using that as a basis for helping Essbase do its job faster.
