So, just what is this EIS thing? You’ve heard about it, you know it has something to do with outlines, but you haven’t used it and you just don’t know where to start. I understand. I’ve been there. I couldn’t really see an immediate payoff to using it, which kind of made getting all setup a little more daunting. Please note that this article is written referring mostly to version 7 of EIS — I’m not sure what changes may have occurred since then.
Interestingly, my motivation for using EIS was a bit odd. I was building some new cubes for the enterprise and they were in ASO for the first time. The cubes were the evolution of a set of cubes that had been around in the company for a number of years, and the goal was to take what worked (and avoid what didn’t), and apply it for the entire organization. Which is huge. Hence the reason for ASO. Along with learning all of the quirks that ASO brings to the table versus BSO, I also ran into another issue. The original cubes, as part of their calculation method, would FIX on all of the accounts related to Gross Profit, flip the sign, and then roll up the whole cube. The reason for this is that the GP accounts come in their “natural” accounting sign, so something like a sales account would be negative in the source database. But since there are no calc scripts in ASO, I had to come up with another solution. Well, it turns out that there’s this neat little feature on load rules that lets you flip the sign on a particular UDA.
Given that the Accounts dimension changes from period to period (and has a bajillion members in it), it was necessary to come up with a mechanism to tag all of the appropriate accounts with the UDA I needed. I got this working just fine with a load rule, ran it, and voila, I had a nice shiny UDA called “GP” on the members I needed. I was feeling pretty pleased with myself… until the next time I ran the automation. I ran it again and again for testing purposes. And when I cracked open the outline again in EAS, I noticed that my members had about 20 copies of the “GP” UDA on them.
As it turns out, I believe this was a bonafide bug in Essbase 7.x that was fixed at some point — at the time I was writing the automation I believe my servers were 7.1.2. But at the time we had no plans to put in the point upgrade, and not being the kind of guy that likes to wait around anyway, I decided to take the somewhat unconventional approach and just implement the entire thing in EIS. So, you can honestly say that my entire reason for picking up EIS is because my UDAs were multiplying like tribbles on me, but that’s life, funny things like that happen.
So, getting back to the main idea here, what exactly is EIS? In short, it’s a tool for creating outlines based on relational data. It essentially takes the place of editing your outlines in EAS, using dimension build Load rules. You can also load data through EIS (although I typically decline to do so and instead automate it with MaxL elsewhere). And, unlike EAS with it’s oh-why-don’t-you-just-stab-me-in-the-eyes-already interface, EIS has a pretty slick interface. In fact, the interface is so nice, it makes me just a little bit tingly on the inside… but then again that could just be related to my unnatural obsession with all things multi-dimensional.
Why use EIS? Once you get good at it, and have some good upstream data to work with, you can crank out some outlines pretty fast. You can also keep them updated very easily, by virtue of updating the source relational data that EIS reads. I’m also completely and utterly sick of whipping up new load rules to update dimensions. In the case of some of my attribute dimensions, I can’t even imagine the pain I would have to go through to implement the same functionality with a load rule. EIS is also the tool you’ll need to use to link up to some drill-through data.
To get started with EIS, you need to make sure that EIS is installed on a server somewhere. I just have mine running on the Essbase server itself and I find I am happy with this approach. EIS will store all of it’s data in something referred to as the “metadata catalog,” which is just a SQL database that you’ll need to setup. Oddly enough, when I started using EIS, I didn’t actually know I had a SQL server, but I figured there was one somewhere, so I started pinging things, and behold, I found a SQL box laying around (I guess the proper way of doing this would be to fill out a capital appropriations request for a server or something, but this makes a way better story). It’s a SQL Server box with modest specs, but it gets the job done just fine. It’s also the same server that I use to hold all of the relational data that I use for building outlines.
In a nutshell, you need to create a new database, then use one of the scripts that comes with EIS in order to populate the new database with some initial data. This data is simply something that EIS will use under the hood and you won’t have to (and shouldn’t) edit the data by hand once you get it all loaded up. After you have the shell of the metadata catalog setup, you will need to define some data sources from the EIS server to your relational data. In my case, with Windows servers, this meant just setting up an ODBC connection on the Essbase server and pointing it to another new SQL database on the SQL server.
At this point, I would highly recommend following the EIS instructions and setting up the data they include for TBC (The Beverage Company). Setting up this example means that you will be setup with the EIS Model for TBC, as well as a metaoutline for TBC.
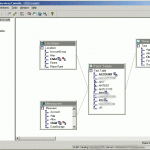
In EIS terminology, you create a model first, then a metaoutline. A model is something you create in order to link together your SQL tables and tell EIS how they relate to each other. At the center of this model you will have a Fact Table. You can sort of think of the Fact Table as being similar in nature to the type of data that you would load to your Essbase cube with a normal load rule. For example, if the rows in your data file had fields for the scenario, year, time period, location, department, measure, then a dollar amount or other figure, you can think of this as your fact table. In this case, think of the different time periods for a moment. In a typical periods/quarters/year setup, your text file would just have an 01 for period 01, an 02 for period 02, and so on. Generally the source data wouldn’t make any sort of mention of the quarters, for example, but EIS needs to know about this. On the model, you would link the Period on the fact table to another table in your relational database that shows how to build the Time dimension based on that data.
The metaoutline has to be created after the model, because it is highly dependant on the way the model is setup. In fact, when you create the metaoutline, you tell EIS which model to base it off of. As the seasoned EIS veterans know about models and metaoutlines, once you commit to something in the model, you are basically married to it. You can’t go around gutting the model too much unless you first make changes to your metaoutline(s).
If you’ve setup the model in a sane manner, you can then use the dimensions/tables you defined sort of as Lego blocks in your metaoutline, you can mix and match different dimensions and come up with a working outline. You can even create arbitrary members in dimensions or completely new dimensions, if that’s what you need for that particular outline. Try your best to keep it in the model though — it’ll usually pay off in the long run.
With the metaoutline properly defined, you can then load the members to a cube. This is a straightforward process (assuming everything is setup correctly) where EIS will take your metaoutline, which is in turn based off your model, which is in turn based off your relational (SQL) data, and build a completely fresh outline for you. Of course, this process can be automated (as with just about everything else). If you’ve built everything correctly you can also load data through EIS too, although in practice I tend to find myself leaving that to an automation system, but it’s always good to know that your models are built properly.
The barriers to entry for setting up EIS can be daunting if you aren’t already using it. You have to install it on a server, setup a SQL database for the metadata catalog, have some source data in SQL that you want to use to build/load outlines (which may require you to brush up on your SQL skills if you’re a bit rusty), and figure out how the tool works. As always, learning from examples and experimenting on your own are very good ways to go — so if you can get the EIS demo app installed you should be able to see how things are put together. The payoff though, for using EIS, can be immense. You don’t have to mess around with all those dimension build load rules, you can spin up new outlines in a jiffy (without necessarily reinventing the wheel everytime), and girls think it’s pretty cool (and for all you female cube geeks out there, I’m sure the guys will be impressed too).
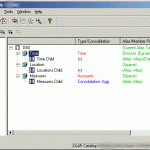
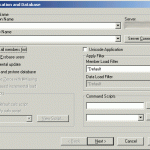
If you’re still curious about EIS (and who wouldn’t be?), feel free to drop me a line. Also, if you’d like to see more articles about EIS, let me know and I get dig into some of the more complex stuff. The screenshots below show some EIS screens — a model, a metaoutline, and building an outline from a metaoutline. See in the model how the fact table is in the middle, with some other dimensions attached to it. I blurred out some server information, but it doesn’t affect the purpose of the screenshot.
- A view of an EIS model
- A view of a metaoutline
- The outline load dialog


