Essbase and SQL Server Express: just don’t

I’m working on a writeup on how to get a fully functional Essbase server up and running in a virtual machine (using Sun VirtualBox).  I’m currently working on the steps — setting up the Essbase funtionality is relatively straightforward, although you need a relational database to store various information.

“No problem,” I thought to myself, “I’ll just pop on a copy of SQL Server Express.” Oh how naive I was.  In theory, I’m sure it’s possible to use SQL Server Express as the backend for a Hyperion installation, but after fiddling around with various options, enabling TCP/IP, and doing everything else I could think of, I just couldn’t get things to work.  So I yanked it off the virtual machine and put the real deal on — a full copy of SQL Server 2005 — and presto!  I was up and running in no time.  So if you happen to reach this blog article because you googled “SQL Server Express Essbase oh for the love of god why do you mock me” or something similar, I hope this popped first to let you know you may be in for a bumpy ride.

Update: Several of my readers have commented on how they’ve been successfully using SQL Server Express for their purposes.  I didn’t spend an incredible amount of time trying to configure Express to work, and given that the full version of SQL Server is available to me, I went ahead and installed that without looking back.  As I suspected, you need to play with the connection settings a bit in order to get things to work, and if someone cares to do a writeup of what that procedure looks like, I’d be more than happy to post it here.  Thanks for the suggestions, all.

Essbase Performance Optimization: it’s not just the calc script

Here’s a quick post that is a bit of a precursor to some of my more in-depth performance analysis articles that will be coming out in the future.  One of my automation systems takes a bit over an hour to run.  There are a lot of people I know that need to squeeze performance out of their systems and immediately look to their calc scripts.  Yes, calc time can be a large part of your downtime, as can data loads, reports, and other activities.  But I always stress that it is useful and important to understand your systems in their entirety.

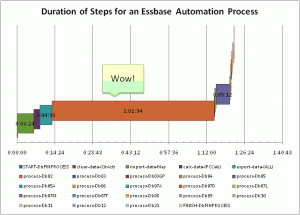
As part of looking at the bigger picture, I put together the following graph showing each step and how long it takes in this system that takes around an hour.  It’s not hard to tell that the majority of the time that it takes to run this job (the brownish bar that takes about an hour) is in one task!  And what is that task?  It’s a bunch of report scripts running on a staging database.  This is clearly an obvious place for me to look at ways of saving time.

Duration of Steps for an Essbase Automation Process

Duration of Steps for an Essbase Automation Process

The staging database is is a rather clever cube that is essentially used to scrub, aggregate, and associate raw account level data to some more meaningful dimensional combinations for all of the other databases.  Data comes in, it’s calculated, and it outputs a bunch of report scripts.  Fundamentally, the reason that this approach takes so much time is that there are two highly sparse dimension combinations with tens of thousands of members each, and the report script writer has to go through a ton of on-disk data in order to figure out what to write.  I could spend some time trying to optimize this process, in fact, I could probably play with some settings and get at least 20% improvement right now.

But, this is one of those times where it pays to stand back and look at what we’re trying to accomplish.  As it turns out, I actually have all of the infrastructure I need to accomplish this task, but it’s in a SQL database.  And, the task that is being performed is actually much more conducive to the way that a relational database works.  I’m still putting the finishing touches on this process, but it’s mostly complete as of right now, and the performance is amazing.  I can pump through the same amount of data in mere minutes now, with no loss of functionality.

My specific goal is to get this process that takes an hour or longer, to run in less than five minutes.  I chose this instead of “as fast as possible” because I wanted something concrete and attainable.  (My secret goal, just for kicks, is to get this all to run in under a minute).  Once the automation for the SQL staging is all in place, I will be going through all of the individual databases and tweaking any and all settings in order to shave their downtime as well.

Historically, not a lot of effort has gone into extensive profiling on these cubes, so as nerdy as it sounds, I’m actually very interested to see where else I can shave a few seconds off.  At first this will undoubtedly involve using more write threads in the dataload, rewriting the calc scripts to tighten them up from just their current CALC ALL, aligning the order of the data fields and rows with the dense/sparse-ness of the outlines and the outline order, choosing better cache settings that are customized for the size of the index and page files, and perhaps looking at benefits of zlib compression (theoretically more CPU time to compress/decompress, however, generally the CPUs on these servers are not slammed very hard, so if I can get the size of the physical page files down, I may be able to read it into memory faster).

So remember — you spend a lot of time doing calculations, but that might not alway be where the low hanging fruit is.  I cannot stress enough the importance of understanding where you spend your time, and using that as a basis for helping Essbase do its job faster.

Some performance observations changing an ASO hierarchy from Dynamic to Stored

There are numerous ASO cubes among my flock.  Usually the choice to use ASO was not arrived at lightly — it was/is for very specific technical reasons.  Typically, the main reason I have for using ASO is to get the fast data loads and the ability to load oodles of noodles… I mean data.  Yes, oodles of data.  The downsides (with version 7.x) is that I’m giving up calc scripts, incremental loading (although this has been somewhat addressed in later versions), native Dynamic Time Series, some flexiblity with my hierarchies, and I have to have just one database per application (you… uhh… were doing that already, right?).  Also, due to the sparsity of much of the data, trying to use BSO would result in a very unwieldy cube in this particular instance.

I have a set of four cubes that are all very similar, except for different Measures dimensions.  They range from 10,000 to 40,000 members.  This isn’t huge, but in conjunction with the sizes of the other dimensions, there is an incredible “maximum possible blocks” potential (sidenote for EAS: one of the most worthless pieces of information to know about your cube.  Really, why?).  The performance of these cubes is generally pretty acceptable (considering the amount of data), but occasionally user Excel queries (especially with attribute dimensions) really pound the server and take awhile to come back.  So I started looking into ways to squeeze out a little more performance.

Due to the nature of the aggregations in the cubes, they all have Dynamic hierarchies in the Accounts/Measures dimension.  This is due to using the minus (-) operator, some label only stuff, and shared members, all of which ASO is very particular with, especially in this version.  All of the other dimensions have Stored hiearchies or are set to Multiple Hierarchies (such as the MDX calcs in the Time dimension to get me some Year-To-Date members).

Actually, it turns out that all of the these cubes have Measures dimensions that make it prohibitively difficult to set Measures to Stored instead of Dynamic, except for one.  So, even though I would need to spin off a separate EIS metaoutline in order to build the dimension differently (these cubes are all generated from the same metaoutline but with different filters), it might be worth it if I can get some better performance on retrieves to this cube — particularly when the queries start to put some of the attribute dimensions or other MDX calcs into play.

What I need is some sort of method to test the performance of some typical retrieves against the two variants of the cube.  I setup one cube as normal, loaded it up with data, and materialized 1 gig worth of aggregations.  Prior to this I had also copied the cube within EAS, made the tweak to Measures to change it from Dynamic to Stored, loaded the data, did a gig of aggregations.  At this point I had two cubes with identical data but one with a Dynamic hierarchy (Measures with 10,000 or so members) and one with stored.  Time to compare.

I cooked up some report scripts, MaxL scripts, and some batch files.  The batch file loads a configuration file which specifies which database to hit and which report to run.  It then runs the report against the database, sets a timestamp before and after it runs, and dumps it all to a text file.  It’s not an exact science, but in theory it’ll give me somewhat of an idea as to whether making the hierarchy Stored is going to help my users’ retrieval operations.  And without further ado, here are the results:

Starting new process at Tue 01/20/2009 10:11:08.35 Time Duration Winner
start-report_01-DB (Dynamic) 11:10.0
finish-report_01-DB (Dynamic) 11:13.4 00:03.4
start-report_01-DB (Stored) 11:14.6
finish-report_01-DB (Stored) 11:21.4 00:06.8 Dynamic
start-report_02-DB (Dynamic) 11:22.6
finish-report_02-DB (Dynamic) 11:51.9 00:29.3
start-report_02-DB (Stored) 11:53.0
finish-report_02-DB (Stored) 12:00.0 00:07.0 Stored
start-report_03-DB (Dynamic) 12:01.3
finish-report_03-DB (Dynamic) 12:02.2 00:00.9
start-report_03-DB (Stored) 12:03.9
finish-report_03-DB (Stored) 12:42.1 00:38.2 Dynamic
start-report_04-DB (Dynamic) 12:43.6
finish-report_04-DB (Dynamic) 12:50.2 00:06.6
start-report_04-DB (Stored) 12:51.3
finish-report_04-DB (Stored) 14:26.4 01:35.1 Dynamic
start-report_05-DB (Dynamic) 14:36.3
finish-report_05-DB (Dynamic) 15:18.3 00:42.0
start-report_05-DB (Stored) 15:19.6
finish-report_05-DB (Stored) 17:32.0 02:12.4 Dynamic
Starting new process at Tue 01/20/2009 10:30:55.65
start-report_01-DB (Dynamic) 30:57.5
finish-report_01-DB (Dynamic) 30:59.9 00:02.4
start-report_01-DB (Stored) 31:01.0
finish-report_01-DB (Stored) 31:05.8 00:04.7 Dynamic
start-report_02-DB (Dynamic) 31:07.7
finish-report_02-DB (Dynamic) 31:40.8 00:33.1
start-report_02-DB (Stored) 31:42.5
finish-report_02-DB (Stored) 31:46.1 00:03.5 Stored
start-report_03-DB (Dynamic) 31:50.4
finish-report_03-DB (Dynamic) 31:51.0 00:00.6
start-report_03-DB (Stored) 31:52.4
finish-report_03-DB (Stored) 31:52.8 00:00.3 Tie
start-report_04-DB (Dynamic) 31:54.0
finish-report_04-DB (Dynamic) 32:06.3 00:12.3
start-report_04-DB (Stored) 32:12.1
finish-report_04-DB (Stored) 32:51.4 00:39.3 Dynamic
start-report_05-DB (Dynamic) 32:55.5
finish-report_05-DB (Dynamic) 33:38.1 00:42.6
start-report_05-DB (Stored) 33:39.7
finish-report_05-DB (Stored) 36:42.5 03:02.8 Dynamic

So, interestingly enough, the Dynamic dimension comes out on top, at least for most of the tests I wrote. There is one of the tests though (report_02) that seems to completely smoke the Dynamic hierarchy.  I wrote these report scripts kind of randomly, so I definitely need to do some more testing, but in the mean time I think I feel better about using a Dynamic hierarchy.  Since the ASO aggregation method for these cubes is simply to process aggregations until the database size is a certain multiple of it’s original size, one of the next steps I could look at for query optimization would be to enable query tracking, stuff the query statistics by running some reports, and then using those stats to design the aggregations.  In any case, I’m glad I am looking at some actual data rather than just blindly implementing a change and hoping for the best.

This isn’t to say that Dynamic is necessarily better than Stored or vice versa, however, I ran this very limited number of tests numerous times and got essentially the same results.  For the least part, this goes to show that there isn’t really a silver bullet for optimization and that experimentation is always a good way to go (except on your production servers, of course).  I am curious, however to go back and look at report_02 and see what it is about that particular report that is apparently so conducive to Stored hierarchies.

Delete that stubborn Essbase application in EAS!

Sometimes you need to delete an Application but you can’t.  You still see it in Essbase Administration Services or even Application Manager (hey, there’s nothing wrong with still being on 6.5.x, if it ain’t broke…), but the app is broken or doesn’t exist.  The simplest cause of this is that someone [probably you] deleted the folder that contained the app, but you didn’t delete it through EAS.  And now, paradoxically enough, when you go in to EAS to delete the app, you can’t, because it can’t be started, because it doesn’t exist.  So essentially, the Essbase server tracks databases based not just on the existences of their folder, but also via some other means.

The easiest and most consistent method that I’ve come up with to kill the unruly app is this (assuming you have an extra Essbase server laying around):

  1. On a separate Essbase server (your test server, for example), create an app of the same name, then create a database of the same name (you just have one database to an app, right?   No?  Well, go ahead and create the same-named databases — and shame on you, for cramming more than one database in an application).  If you already had a copy of the app/database on your test server, you can skip this part and just use the existing files.
  2. Unload/stop the application you just created.
  3. Stop the Essbase service on the server giving you troubles.
  4. Copy the entire folder containing the new app to the proper location on the server that is messed up.  For example, if using Windows, if the name of your bad application is BadApp, right click on this folder from Windows Explorer and select Copy, then paste it into the app/folder on the server with the messed up app.  Use the appropriate cp -R command for Unix variants.
  5. Restart the Essbase service, if necessary.
  6. Start the App that was giving you problems.
  7. Delete it (and make sure when you right click on Delete, you press it with authority.  You show that Essbase server who the boss is.)

This approach has always worked for me.  If you don’t have access to another Essbase server, you may be able to get away with following these steps, to an extent, using the same server —  I think I got that approach to work once but I really had to play with it and create the app with a different name, then go in and edit some of the files.

In any case, I hope this helps someone out there that is sick of looking at non-existant apps in their EAS view or just needs to fix something that went corrupt on them — so good luck y’all.

How to copy an Essbase application from one server to another

I got a question from a reader about how to do this.  Specifically, they were copying an application from one server to another and everything seemed to be going fine, except that there was no data in the resultant database on the target server.  The reason for this is that when you copy Essbase apps between servers, the data does not get copied.  If you copy the app on the server, it will copy the data.  So, how do we accomplish this?

For BSO cubes, the easiest option to do a cross server data copy is to copy the application by right-clicking on it, selecting Copy, then choosing the target server.  Then right-click on the database and select Export…. The export file will show up in your App folder were all of the Essbase applications are.  On your new (but empty) database that you just created from a copy, you can load this data.  If you have access to the File System locations, you can load the file across the servers, otherwise, you may have to copy/move the newly created export text file to a location that you can get to through the EAS Load file dialog box.  You don’t need any load rules since the data is already formatted in a way that is native to the application (just don’t make any changes to the outline before you import the data).

As I mentioned, when you copy an application to a new name on the same server, it will take the data with it — and anything in same folder as the app, for that matter.  So if you’re in the habit of storing gigs and gigs of text files in your database folder, get ready for a long wait as everything copies.  At least in version 7 of Essbase, copying huge applications is not a very graceful operation — it can stall the server while files are copying.  Even the best RAID setup can really take a pounding from all the reading and writing necessary to duplication an application.

For ASO databases, your options are a bit more limited since you can’t just do a database export.  You can still copy the applcation (and all it’s rule files and report scripts and such) across servers, though.  As I’m sure you’re aware by now, ASO databases can be quite a bit more fickle than BSO — and you’re quite used to ASO dumping all of your data when you even so much as look at the outline in the wrong way.  But part of the reason you are using ASO in the first place is for the fast loading times, even with massive datasets.  You can follow your same steps and load back data to ASO through EAS, or if you have setup your automation correctly, you can run your scripts and populate your new copy of the ASO application/database.

An Introduction Essbase Integration Services (EIS)

So, just what is this EIS thing?  You’ve heard about it, you know it has something to do with outlines, but you haven’t used it and you just don’t know where to start.  I understand.  I’ve been there.  I couldn’t really see an immediate payoff to using it, which kind of made getting all setup a little more daunting.  Please note that this article is written referring mostly to version 7 of EIS — I’m not sure what changes may have occurred since then.

Interestingly, my motivation for using EIS was a bit odd.  I was building some new cubes for the enterprise and they were in ASO for the first time.  The cubes were the evolution of a set of cubes that had been around in the company for a number of years, and the goal was to take what worked (and avoid what didn’t), and apply it for the entire organization.  Which is huge.  Hence the reason for ASO.  Along with learning all of the quirks that ASO brings to the table versus BSO, I also ran into another issue.  The original cubes, as part of their calculation method, would FIX on all of the accounts related to Gross Profit, flip the sign, and then roll up the whole cube.  The reason for this is that the GP accounts come in their “natural” accounting sign, so something like a sales account would be negative in the source database.  But since there are no calc scripts in ASO, I had to come up with another solution.  Well, it turns out that there’s this neat little feature on load rules that lets you flip the sign on a particular UDA.

Given that the Accounts dimension changes from period to period (and has  a bajillion members in it), it was necessary to come up with a mechanism to tag all of the appropriate accounts with the UDA I needed.  I got this working just fine with a load rule, ran it, and voila, I had a nice shiny UDA called “GP” on the members I needed.  I was feeling pretty pleased with myself… until the next time I ran the automation.  I ran it again and again for testing purposes.  And when I cracked open the outline again in EAS, I noticed that my members had about 20 copies of the “GP” UDA on them.

As it turns out, I believe this was a bonafide bug in Essbase 7.x that was fixed at some point — at the time I was writing the automation I believe my servers were 7.1.2.  But at the time we had no plans to put in the point upgrade, and not being the kind of guy that likes to wait around anyway, I decided to take the somewhat unconventional approach and just implement the entire thing in EIS.  So, you can honestly say that my entire reason for picking up EIS is because my UDAs were multiplying like tribbles on me, but that’s life, funny things like that happen.

So, getting back to the main idea here, what exactly is EIS?  In short, it’s a tool for creating outlines based on relational data.  It essentially takes the place of editing your outlines in EAS, using dimension build Load rules.  You can also load data through EIS (although I typically decline to do so and instead automate it with MaxL elsewhere).  And, unlike EAS with it’s oh-why-don’t-you-just-stab-me-in-the-eyes-already interface, EIS has a pretty slick interface.  In fact, the interface is so nice, it makes me just a little bit tingly on the inside… but then again that could just be related to my unnatural obsession with all things multi-dimensional.

Why use EIS?  Once you get good at it, and have some good upstream data to work with, you can crank out some outlines pretty fast.  You can also keep them updated very easily, by virtue of updating the source relational data that EIS reads.  I’m also completely and utterly sick of whipping up new load rules to update dimensions.  In the case of some of my attribute dimensions, I can’t even imagine the pain I would have to go through to implement the same functionality with a load rule.  EIS is also the tool you’ll need to use to link up to some drill-through data.

To get started with EIS, you need to make sure that EIS is installed on a server somewhere.  I just have mine running on the Essbase server itself and I find I am happy with this approach.  EIS will store all of it’s data in something referred to as the “metadata catalog,” which is just a SQL database that you’ll need to setup.  Oddly enough, when I started using EIS, I didn’t actually know I had a SQL server, but I figured there was one somewhere, so I started pinging things, and behold, I found a SQL box laying around (I guess the proper way of doing this would be to fill out a capital appropriations request for a server or something, but this makes a way better story).  It’s a SQL Server box with modest specs, but it gets the job done just fine.  It’s also the same server that I use to hold all of the relational data that I use for building outlines.

In a nutshell, you need to create a new database, then use one of the scripts that comes with EIS in order to populate the new database with some initial data.  This data is simply something that EIS will use under the hood and you won’t have to (and shouldn’t) edit the data by hand once you get it all loaded up.  After you have the shell of the metadata catalog setup, you will need to define some data sources from the EIS server to your relational data.  In my case, with Windows servers, this meant just setting up an ODBC connection on the Essbase server and pointing it to another new SQL database on the SQL server.

At this point, I would highly recommend following the EIS instructions and setting up the data they include for TBC (The Beverage Company).  Setting up this example means that you will be setup with the EIS Model for TBC, as well as a metaoutline for TBC.

In EIS terminology, you create a model first, then a metaoutline.  A model is something you create in order to link together your SQL tables and tell EIS how they relate to each other.  At the center of this model you will have a Fact Table.  You can sort of think of the Fact Table as being similar in nature to the type of data that you would load to your Essbase cube with a normal load rule.  For example, if the rows in your data file had fields for the scenario, year, time period, location, department, measure, then a dollar amount or other figure, you can think of this as your fact table.  In this case, think of the different time periods for a moment.  In a typical periods/quarters/year setup, your text file would just have an 01 for period 01, an 02 for period 02, and so on.  Generally the source data wouldn’t make any sort of mention of the quarters, for example,  but EIS needs to know about this.  On the model, you would link the Period on the fact table to another table in your relational database that shows how to build the Time dimension based on that data.

The metaoutline has to be created after the model, because it is highly dependant on the way the model is setup.  In fact, when you create the metaoutline, you tell EIS which model to base it off of.  As the seasoned EIS veterans know about models and metaoutlines, once you commit to something in the model, you are basically married to it.  You can’t go around gutting the model too much unless you first make changes to your metaoutline(s).

If you’ve setup the model in a sane manner, you can then use the dimensions/tables you defined sort of as Lego blocks in your metaoutline, you can mix and match different dimensions and come up with a working outline.  You can even create arbitrary members in dimensions or completely new dimensions, if that’s what you need for that particular outline.  Try your best to keep it in the model though — it’ll usually pay off in the long run.

With the metaoutline properly defined, you can then load the members to a cube.  This is a straightforward process (assuming everything is setup correctly) where EIS will take your metaoutline, which is in turn based off your model, which is in turn based off your relational (SQL) data, and build a completely fresh outline for you.  Of course, this process can be automated (as with just about everything else).  If you’ve built everything correctly you can also load data through EIS too, although in practice I tend to find myself leaving that to an automation system, but it’s always good to know that your models are built properly.

The barriers to entry for setting up EIS can be daunting if you aren’t already using it.  You have to install it on a server, setup a SQL database for the metadata catalog, have some source data in SQL that you want to use to build/load outlines (which may require you to brush up on your SQL skills if you’re a bit rusty), and figure out how the tool works.  As always, learning from examples and experimenting on your own are very good ways to go — so if you can get the EIS demo app installed you should be able to see how things are put together.  The payoff though, for using EIS, can be immense.  You don’t have to mess around with all those dimension build load rules, you can spin up new outlines in a jiffy (without necessarily reinventing the wheel everytime), and girls think it’s pretty cool (and for all you female cube geeks out there, I’m sure the guys will be impressed too).

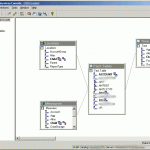
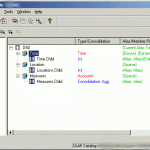
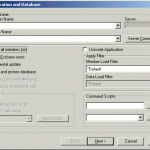
If you’re still curious about EIS (and who wouldn’t be?), feel free to drop me a line.  Also, if you’d like to see more articles about EIS, let me know and I get dig into some of the more complex stuff.  The screenshots below show some EIS screens — a model, a metaoutline, and building an outline from a metaoutline.   See in the model how the fact table is in the middle, with some other dimensions attached to it.  I blurred out some server information, but it doesn’t affect the purpose of the screenshot.

Essbase, the economy and thoughts from the last ODTUG

I was going through some papers today and I happened to come across a sheet of my notes that I jotted down while I was at ODTUG in New Orleans last year (the best Hyperion conference around, seriously).  Coincidentally, earlier in the day I also had a conversation with a colleague of mine who works at a sizable company that does not significantly utilize BI/EPM.  She said they had looked at some options, including Essbase, but at the end of the day that just couldn’t justify the cost to get up and running — especially in “this economy” where everything else is being cut back, scaled down, or eliminated.

My question to her was this: how can you afford not to?  I noticed that many of the points I had taken away from various presenters and people I talked to at the conference wove in perfectly with this company’s predicament.  In the next paragraph I’ve italicized my original notes and added some context .  So, is investing in Essbase worth the money, especially in this economy where each dollar is even more critical than before?  Yes.

There are countless ways for companies to improve their business.  Essbase is just one of the many tools that companies can put in their toolbox.  Many companies have built up vast warehouses of data over the years, but aren’t leveraging it.  Even if your company is already using Hyperion, Oracle, or other software to analyze data, there is probably a lot of room to expand the usage.  You know why?  Because companies under-utilize the tools that they have. It takes mastery to unlock the full potential of a tool.

Essbase is worth its weight in gold, because when it’s implemented properly, it can tell you a lot about your business.  Specifically, it can tell you where you are losing money. Tools such as Essbase and associated functionality are about doing business better, not just doing business. It is a very adept tool for painting a picture of alternative futures because this is where the improvements happen.

I was pretty happy to come across a sheet of my notes that I had tucked away, because many of things I saw and heard at the conference were so poignant — and directly applicable to the real world.  It’s nice to step back for a moment from being so engrossed in the technical aspects of the technology and think for a moment about the bigger picture and why I do what I do.  I enjoy what I do because I have powerful and flexible tools in my toolbox that are the best in the business.  I do my best to put them to good use and this allows me to make a positive impact on the business, help people in the company (who in turn help customers — and the stockholders), and enjoy the recognition that comes from being good at my chosen endeavors.  And to top it all off, it’s just plain fun to be a cube monkey.

MaxL Essbase automation patterns: moving data from one cube to another

A very common task for Essbase automation is to move data from one cube to another.  There are a number of reasons you may want or need to do this.  One, you may have a cube that has detailed data and another cube with higher level data, and you want to move the sums or other calculations from one to the other.  You may accept budget inputs in one cube but need to push them over to another cube.  You may need to move data from a “current year” cube to a “prior year” cube (a data export or cube copy may be more appropriate, but that’s another topic).  In any case, there are many reasons.

For the purposes of our discussion, the Source cube is the cube with the data already in it, and the Target cube is the cube that is to be loaded with data from the source cube.  There is a simple automation strategy at the heart of all these tasks:

  1. Calculate the source cube (if needed)
  2. Run a Report script on the source cube, outputting to a file
  3. Load the output from the report script to the target cube with a load rule
  4. Calculate the target cube

This can be done by hand, of course (through EAS), or you can do what the rest of us lazy cube monkeys do, and automate it.  First of all, let’s take a look at a hypothetical setup:

We will have an application/database called Source.Foo which represents our source cube.  It will have dimensions and members as follows:

  • Location: North, East, South, West
  • Time: January, February, …, November, December
  • Measures: Sales, LaborHours, LaborWages

As you can see, this is a very simple outline.  For the sake of simplicity I have not included any rollups, like having “Q1/1st Quarter” for January, February, and March.  For our purposes, the target cube, Target.Bar, has an outline as follows:

  • Scenario: Actual, Budget, Forecast
  • Time: February, …, November, December
  • Measures: Sales, LaborHours, LaborWages

These outlines are similar but different.  This cube has a Scenario dimension with Actual, Budget, and Forecast (whereas in the source cube, since it is for budgeting only, everything is assumed to be Budget).  Also note that Target.Bar does not have a Location dimension, instead, this cube only concerns itself with totals for all regions.  Looking back at our original thoughts on automation, in order for us to move the data from Source.Foo to Target.Bar, we need to calculate it (to roll-up all of the data for the Locations), run a report script that will output the data how we need it for Target.Bar, use a load rule on Target.Bar to load the data, and then calculate Target.Bar.  Of course, business needs will affect the exact implementation of this operation, such as the timing, the calculation to use, and other complexities that may arise.  You may actually have two cubes that don’t have a lot in common (dimensionally speaking), in which case, your load rule might need to really jump through some hoops.

We’ll keep this example really simple though.  We’ll also assume that the automation is being run from a Windows server, so we have a batch file to kick things off:

cd /d %~dp0
essmsh ExportAndLoadBudgetData.msh

I use the cd /d %~dp0 on some of my systems as a shortcut to switch the to current directory, since the particular automation tool installed does not set the home directory of the file to the current working directory.  Then we invoke the MaxL shell (essmsh, which is in the PATH) and run ExportAndLoadBudgetData.msh.  I enjoy giving my automation files unnecessarily long filenames.  It makes me feel smarter.

As you may have seen from an earlier post, I like to modularize my MaxL scripts to hide/centralize configuration settings, but again, for the sake of simplicity, this example will forgo that.  Here is what ExportAndLoadBudgetData.msh could look like:

/* Copies data from the Budget cube (Source.Foo) to the Budget Scenario
   of Target.Bar */
/* your very standard login sequence here */
login AdminUser identified by AdminPw on EssbaseServer;
/* at this point you may want to turn spooling on (omitted here) */

/* disable connections to the application -- this is optional */
alter application Source disable connects;

/* PrepExp is a Calc script that lives in Source.Foo and for the purposes
   of this example, all it does is makes sure that the aggregations that are
   to be exported in the following report script are ready. This may not be
   necessary and it may be as simple as a CALC ALL; */

execute calculation Source.Foo.PrepExp;

/* Budget is the name of the report script that runs on Source.Foo and outputs a
   text file that is to be read by Target.Bar's LoadBud rules file */

export database Source.Foo
    using report_file 'Budget'
    to data_file 'foo.txt';

/* enable connections, if they were disabled above */
alter application Source enable connects;
/* again, technically this is optional but you'll probably want it */
alter application Target disable connects;

/* this may not be necessary but the purpose of the script is to clear out
   the budget data, under the assumption that we are completely reloading the
   data that is contained in the report script output */

execute calculation Target.Bar.ClearBud;

/* now we import the data from the foo.txt file created earlier. Errors
   (rejected records) will be sent to errors.txt */

import database Target.Bar data
    from data_file 'foo.txt'
    using rules_file 'LoadBud'
    on error write to 'errors.txt';

/* calculate the new data (may not be necessary depending on what the input
   format is, but in this example it's necessary */

execute calculation Target.Bar.CalcAll;

/* enable connections if disabled earlier */
alter application Target enable connects;
/* boilerplate cleanup. Turn off spooling if turned on earlier */

logoff;
exit;

At this point , if we don’t have them already, we would need to go design the aggregation calc script for Source.Foo (PrepExp.csc), the report script for Source.Foo (Budget.rep), the clearing calc script on Target.Bar (ClearBud.csc), the load rule on Target.Bar (LoadBud.rul), and the final rollup calc script (CalcAll.csc).  Some of these may be omitted if they are not necessary for the particular process (you may opt to use the default calc script, may not need some of the aggregations, etc).

For our purposes we will just say that the PrepExp and CalcAll calc scripts are just a CALC ALL or the default calc.  You may want a “tighter” calc script, that is, you may want to design the calc script to run faster by way of helping Essbase understand what you need to calculate and in what order.

What does the report script look like?  We just need something to take the data in the cube and dump it to a raw text file.

<ROW ("Time", "Measures")

{ROWREPEAT}
{SUPHEADING}
{SUPMISSINGROWS}
{SUPZEROROWS}
{SUPCOMMAS}
{NOINDENTGEN}
{SUPFEED}
{DECIMAL 2}

<DIMBOTTOM "Time"
<DIMBOTTOM "Measures"
"Location"
!

Most of the commands here should be pretty self explanatory.  If the syntax looks a little different than you’re used to, it’s probably because you can also jam all of the tokens in one line if you want like {ROWREPEAT SUPHEADING} but historically I’ve had them one to a line.  If there were more dimensions that we needed to represent, we’d put thetm on the <ROW line.  As per the DBAG, we know that the various tokens in between {}’s format the data somehow — we don’t need headings, missing rows, rows that are zero (although there are certainly cases where you might want to carry zeros over), no indentation, and numbers will have two decimal places (instead of some long scientific notation). Also, I have opted to repeat row headings (just like you can repeat row heading in Excel) for the sake of simplicity, however, as another optimization tip, this isn’t necessary either — it just makes our lives easier in terms of viewing the text file and loading it to a SQL database or such.

As I mentioned earlier, we didn’t have rollups such as different quarters in our Time dimension.  That’s why we’re able to get away with using <DIMBOTTOM, but if we wanted just the Level 0 members (the months, in this case), we could use the appropriate report script.  Lastly, from the Location dimension we are taking use the Location member (whereas <DIMBOTTOM “Time” tells Essbase to give us all the members to the bottom of the Time dimension, simply specifying a member or members from the dimension will give us those members), the parent to the different regions.  “Location” will not actually be written in the output of the report script because we don’t need it — the outline of Target.Bar does not have a location dimension since it’s implied that it represents all locations.

The output of the report script will look similar to the following:

January Sales 234.53
January LaborHours 35.23
February Sales 532.35

From here it is a simple matter of designing the load rule to parse the text file.  In this case, the rule file is part of Target.Bar and is called LoadBud.  If we’ve designed the report script ahead of time and run it to get some output, we can then go design the load rule.  When the load rule is done, we should be able to run the script (and schedule it in our job scheduling software) to carry out the task in a consistent and automated manner.

As an advanced topic, there are several performance considerations that can come into play here.  I already alluded to the fact that we may want to tighten up the calc scripts in order to make things faster.  In small cubes this may not be worth the effort (and often isn’t), but as we have more and more data, designing the calc properly (and basing it off of good dense/sparse choices) is critical.  Similarly, the performance of the report script is also subject to the dense/sparse settings, the order of the output, and other configuration settings in the app and database.  In general, what you are always trying to do (performance wise) is to help the Essbase engine do it’s job better — you do this by making the tasks you want to perform more conducive to the way that Essbase processes data.  In other words, the more closely you can align your data processing to the under-the-hood mechanisms of how Essbase stores and manipulates your data, the better off you’ll be.  Lastly, the load rule on the Target database, and the dense/sparse configurations of the Target database, will impact the data load performance.  You may not and probably will not be able to always optimize everything all at once — it’s a balancing act — since a good setting for a report script may result in suboptimal calculation process.  But don’t let this scare you — try to just get it to work first and then go in and understand where the bottlenecks may be.

As always, check the DBAG for more information, it has lots of good stuff in it.  And of course, try experimenting on your own, it’s fun, and the harder you have to work for knowledge, the more likely you are to retain it.  Good luck out there!

The new year, looking back and looking forward with a little Hyperion thrown in

2008 is finally at an end, and a lot happened. In the Hyperion sense of things, 2008 was busy in terms of new versions of software coming out, more name changes (I’ve almost given up trying to stay current with the terminology), and a very successful ODTUG in New Orleans.  The current latest version of things is 11.1.1.1.0.  Now, in my book, for all intents and purposes, System 9 was really version 8 of Essbase, and with no disrespect to the Oracle/Hyperion developers, I think from a development, stability, and feature standpoint, 11.1.1.1.0 is really like version 8.5 of things.  This lines up with the internal under-the-hood versioning scheme of Essbase as well, since internally it is referred to as 9.5 (and keeping in mind that version 8 was totally skipped).

On a more personally relevant Essbase note, 2008 was also a good year for me, my team, and my company.  We rolled out new cubes, rolled out Dodeca (this was really more of an upgrade for us since we have been happily using Dodeca’s spiritual precursor, ActiveOlap, for the better part of a decade), rolled out Essbase to more functional areas within the company, upgraded all of our servers to the same version of Essbase, and we refined and polished many processes and systems that keep the system running. Moreover, we kept our users very happy.  I pride myself on thinking of their needs first and foremost, and I really think it shows in the final product, as well as our willingness to crack open a system and make a small change that helps someone out.

And mostly unrelated to Essbase, 2008 was a good year for me, although I am happy to start anew with 2009.  I spent two weeks with my team in Cincinnati (also, John McCain got into my elevator at my hotel, which was pretty cool).  There was a trip to ODTUG in New Olreans, I drove down to Alabama to go rock climbing with Tim Tow, I climbed to the top of Mt. Baker in the north Cascades here in Washington, I flew down to went to my buddy’s awesome bachelor party in San Diego with 20 other guys, got accepted into the Computer Science program at the University of Washington, finished my first quarter with straight A’s, got to visit my sister/brother-in-law/nephew in Omaha, and too many other things to even mention. I also got to play around with a lot of Java, Python, and C++ this year.

A lot of people make resolutions for the new year.  I’m not much of a new year’s resolution guy because I have specific goals that tend to transcend the boundaries of a calendar.  This last year I made some good progress in getting closer to my goals, and also overcame some challenges. This year I am looking forward to continuing to make progress towards the things I want to accomplish, also knowing full well that there will be even more challenges.

If you haven’t already, take a few minutes for yourself , step back for a moment, assess what you accomplished last year, and ask yourself what it is you want to accomplish.  You really can do anything you want — provided you are willing to make the proper sacrifice for it.    Have a happy new year.

A quick and dirty substitution variable updater

There are a lot of different ways to update your substitution variables.  You can tweak them with EAS by hand, or use one of several different methods to automate it.  Here is one method that I have been using that seems to hit a relative sweet spot in terms of flexibility, reuse-ability, and effectiveness.

First of all, why substitution variables?  They come in handy because you can leave your Calc and Report scripts alone, and just change the substitution variable to the current day/week/month/year and fire off the job.  You can also use them in load rules.  You would do this if you only want to load in data for a particular year or period, or records that are newer than a certain date, or something similar.

The majority of my substitution variables seem to revolve around different time periods.  Sometimes the level of granularity is just one period or quarter (and the year of the current period, if in a separate Years dimension), and sometimes it’s deeper (daily, hourly, and so on).

Sure, we could change the variables ourselves, manually, but where’s the fun in that?  People that know me know that I have a tendency to automate anything I can, although I still try to have respect for what we have come to know as “keeping an appropriate level of human intervention” in the system.  That being said, I find that automating updates to timing variables is almost always a win.

Many organizations have a fiscal calendar that is quite different than a typical (“Gregorian”) calendar with the months January through December.  Not only can the fiscal calendar be quite different, it can have some weird quirks too.  For example, periods may have only four weeks one year but have five weeks in other years, and on top of that, there is some arcane logic used to calculate which is which (well, it’s not really arcane, it just seems that way).  The point is, though, that we don’t necessarily have the functionality on-hand that converts a calendar date into a fiscal calendar date.

One approach to this problem would be to simply create a data file (or table in a relational database, or even an Excel sheet) that maps a specific calendar date to its equivalent fiscal date counterparts.  This is kind of the “brute-force” approach, but it works, and it’s simple.  You just have to make sure that someone remembers to update the file from year to year.

For example, for the purposes of the date “December 22, 2008” in a cube with separate years, time, and weekday dimensions, I need to know three things: the fiscal year (probably 2008), the fiscal period (we’ll say Period 12 for the sake of simplicity, and the day of the week: day “2”).  Of course, this can be very different across different companies and organizations.  Monday might be the first day of the week or something.  If days are included in the Time dimension, we don’t really need a separate variable here.  So, the concepts are the same but the implementation will look different (as with everything in Essbase, right?).

I want something a bit “cleaner,” though.  And by cleaner, I mean that I want something algorithmic to convert one date to another, not just a look-up table.  Check with the Java folks in your company, if you’re lucky then they may already have a fiscal calendar class that does this for you.  Or it might be Visual Basic, or C++, or something else.  But, if someone else did the hard work already, then by all means, don’t reinvent the wheel.

Here is where the approaches to updating variables start to differ.  You could do the whole thing in Java, updating variables with the Java API.  You could have a fancy XML configuration file that is interpreted and tells the system what variables to create, where to put them, and so on.  In keeping with the KISS philosophy, though, I’m going to leave the business logic separate from the variable update mechanism.  Meaning this: in this case I will use just enough program code to generate the variables, then output them to a space-delimited file.  I will then have a separate process that reads the file and updates the Essbase server.  One of the other common approaches here would be to simply output MaxL or ESSCMD script itself, then run the file.  This works great too, however, I like having “vanilla” files that I can load in to other programs if needed (or, say, use in a SQL Server DTS/SSIS job).

At the end of the day, I’ve generated a text file with conents like this:

App1 Db1 CurrentYear 2008
App1 Db1 CurrentPeriod P10
App1 Db1 CurrentWeek Week4
App2 Db1 CurrentFoo Q1

Pretty simple, right?  Note that this simplified approach is only good for setting variables with a specific App/database.  It needs to be modified a little to set global substitution variables (but I’m sure you are enterprising enough to figure this out — check the tech ref for the appropriate MaxL command).

At this point we could setup a MaxL script that takes variables on the command line and uses them in its commands to update the corresponding substitution variable, but there is also another way to do this: We can stuff the MaxL statement into our invocation of the MaxL shell itself.  In a Windows batch file, this whole process looks like this:

SET SERVER=essbaseserver
SET USER=essbaseuser
SET PW=essbasepw

REM generates subvar.conf file
REM this is your call to the Java/VB/C/whatever program that
REM updates the variable file
subvarprogram.exe

REM this isn't strictly needed but it makes me feel better
sleep 2

REM This is batch code to read subvar.conf's 4 fields and pipe
REM them into a MaxL session
REM NOTE: this is ONE line of code but may show as multiple in
REM your browser!

FOR /f "eol=; tokens=1,2,3,4 delims=, " %%i in (subvar.conf) do echo
alter database %%j.%%k set variable %%i %%l; | essmsh -s %SERVER% -l
%USER% %PW% -i 

REM You would use the below statement for the first time you need
REM to initialize the variables, but you will use the above statement
REM for updates to them (you can also just create the variables in
REM EAS)

REM FOR /f "eol=; tokens=1,2,3,4 delims=, " %%i in (subvar.conf) do
echo alter database %%j.%%k add variable %%i; | essmsh -s %SERVER% -l
%USER% %PW% -i

Always remember — there’s more than one way to do it. And always be mindful of keeping things simple — but not too simple.  Happy holidays, ya’ll.