Drillbridge works perfectly with Financial Reporting Web Studio – the successor to the desktop-based version of Financial Reporting (also commonly called HFR, FR). FR was stuck with a very archaic client (let’s just say it’s from around the Clinton administration), but it has revamped for the future, with a completely web-based interface now. In retrospect, and based on my interactions with the interface, I think this product overall can be thought of as gap coverage for FR users. It’s not necessarily the place you want to do new development, especially given some of the other shifts/developments in the reporting ecosystem lately. My colleague Opal Alapat has posted some really great thoughts on FR and its place in this ever-changing world, which I encourage you to read.
In the meantime, there are countless current installs of FR that organizations need to support and perhaps transition to this newer incarnation of FR. As with before, Drillbridge works seamlessly to give you and your users advanced drill-through capabilities in Smart View, Hyperion Planning/PBCS, FR, and now FR web. I found that the UI had a few quirks to it, but I’ll walk through a simple example and try to point those out along the way.
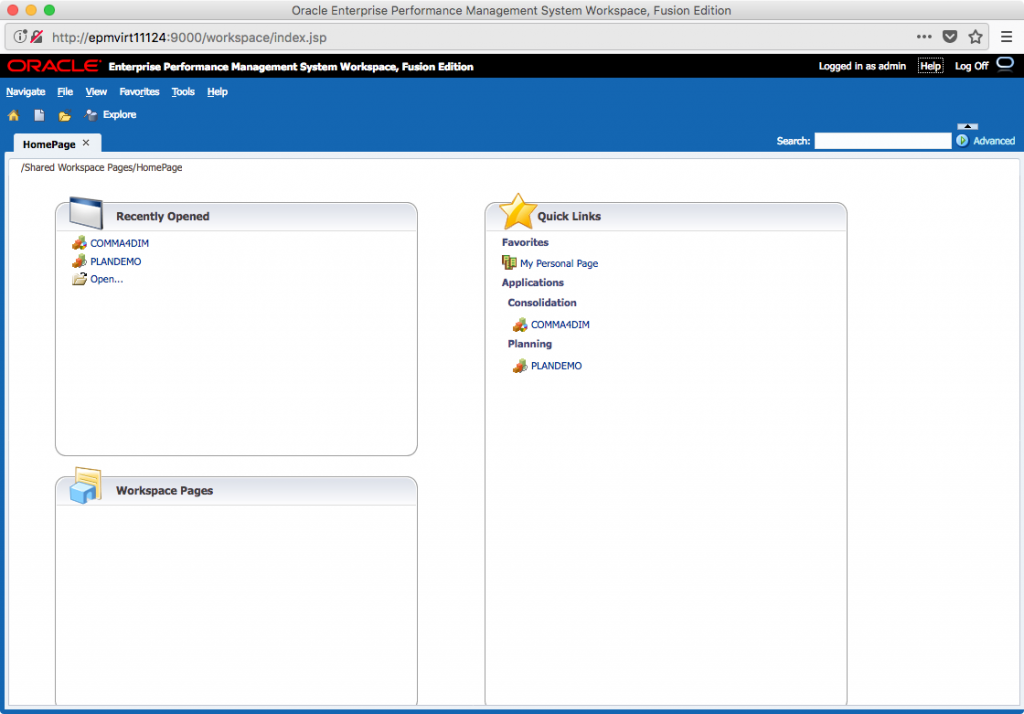
First things first, let’s login to Workspace:
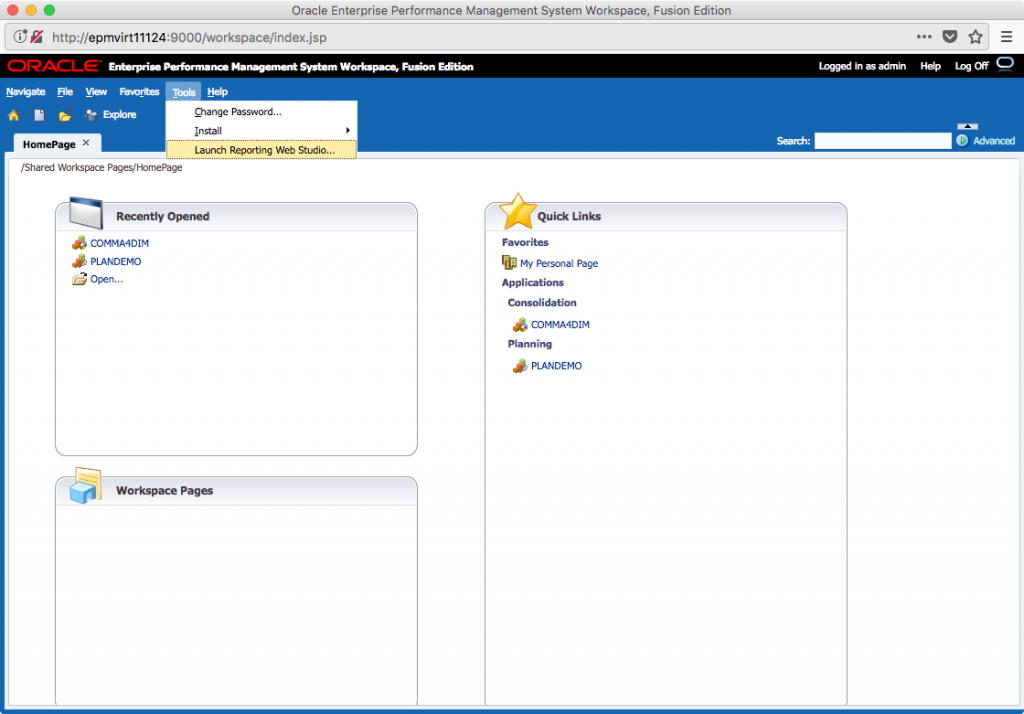
The Tools menu contains our launcher for the web studio:
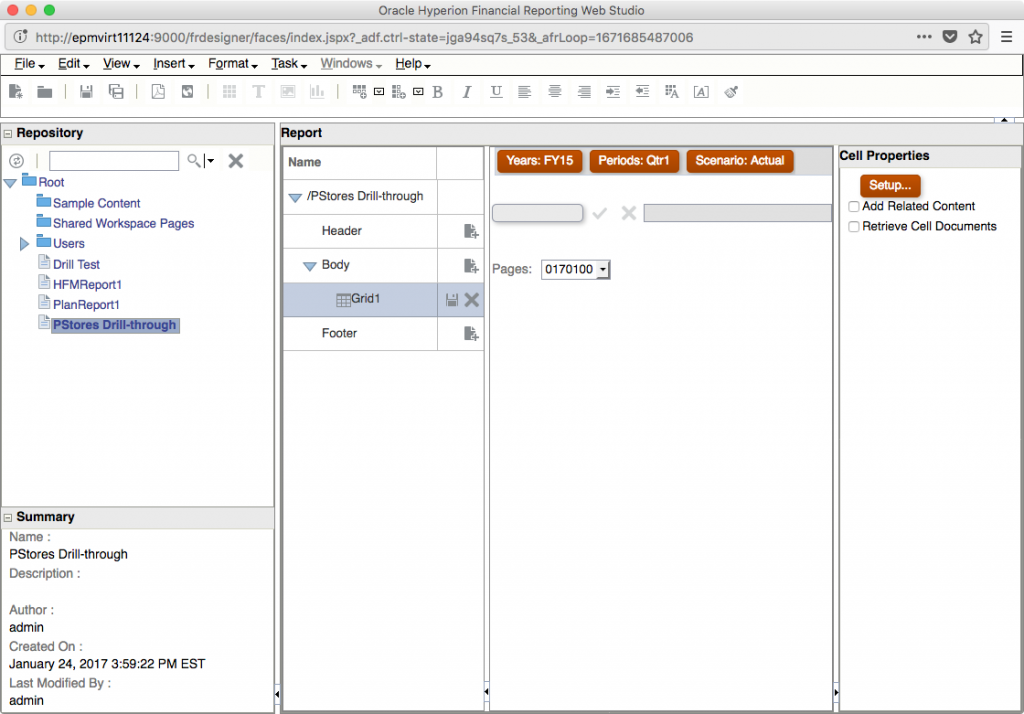
Once we’re there, we should see something like this (results will vary based on your environment of course):
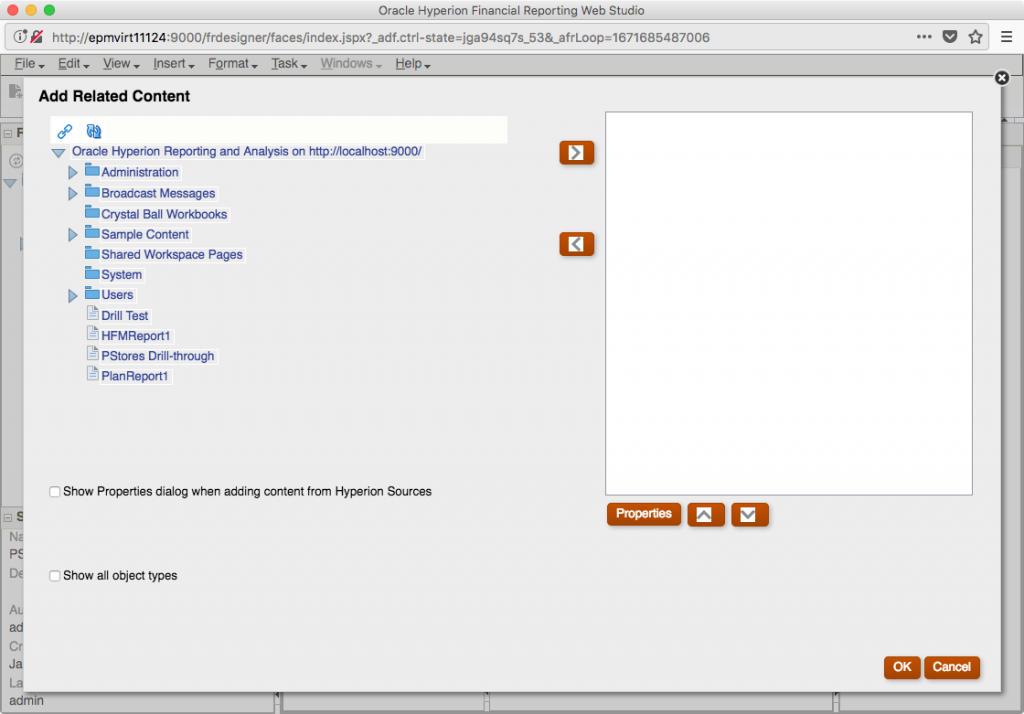
In the preceding screenshot, I have a very simple FR report already opened, and further, it contains a data grid (Grid1). You can’t see it in the above screenshot I have further selected one of the data cells in the Grid1 layout, which has updated the contents of the rightmost pane in the screenshot (Cell Properties). This is where I can setup related content (drill-through). Clicking on the Setup… button brings up the following dialog:
There are no related content definitions, yet, hence the empty list on the right. This is where things got a little funky for me in the UI. It seems that I couldn’t actually edit things in the listbox once I added them, even though it ostensibly let me edit them. I had to remove them and re-add them, and make sure that the title/URL were set exactly right on the first try. Further, the UI is also a little unintuitive in terms of adding custom related content (such as for the Drillbridge definitions), but not too bad. To add a Drillbridge definition, click on the chain/link icon in the top left, then click on the right arrow. This will bring up the following dialog:
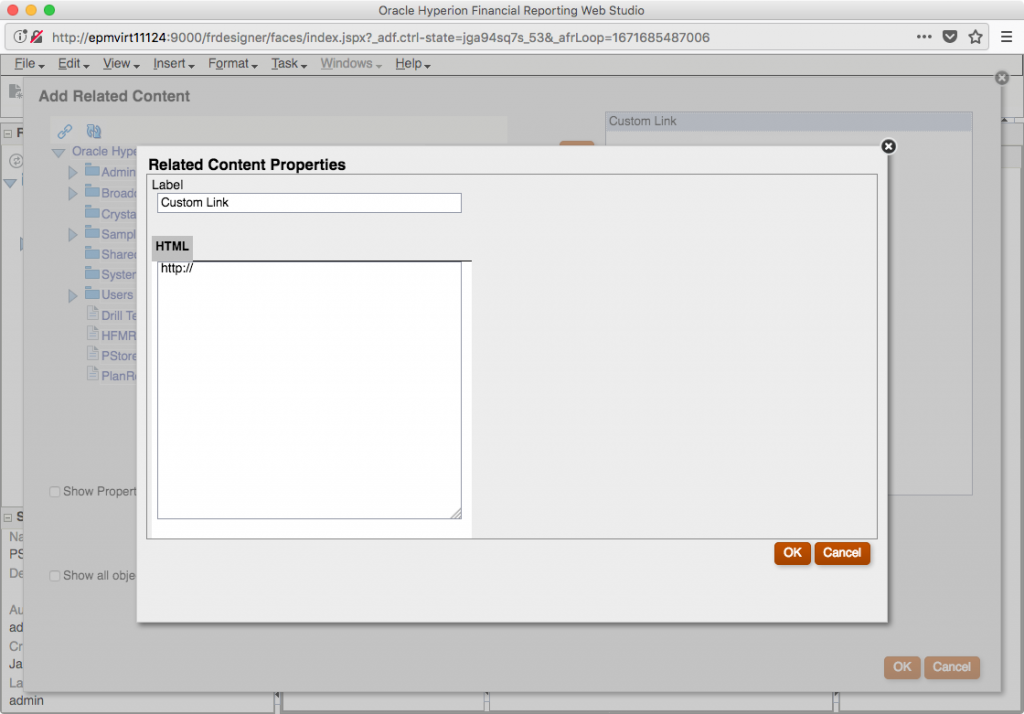
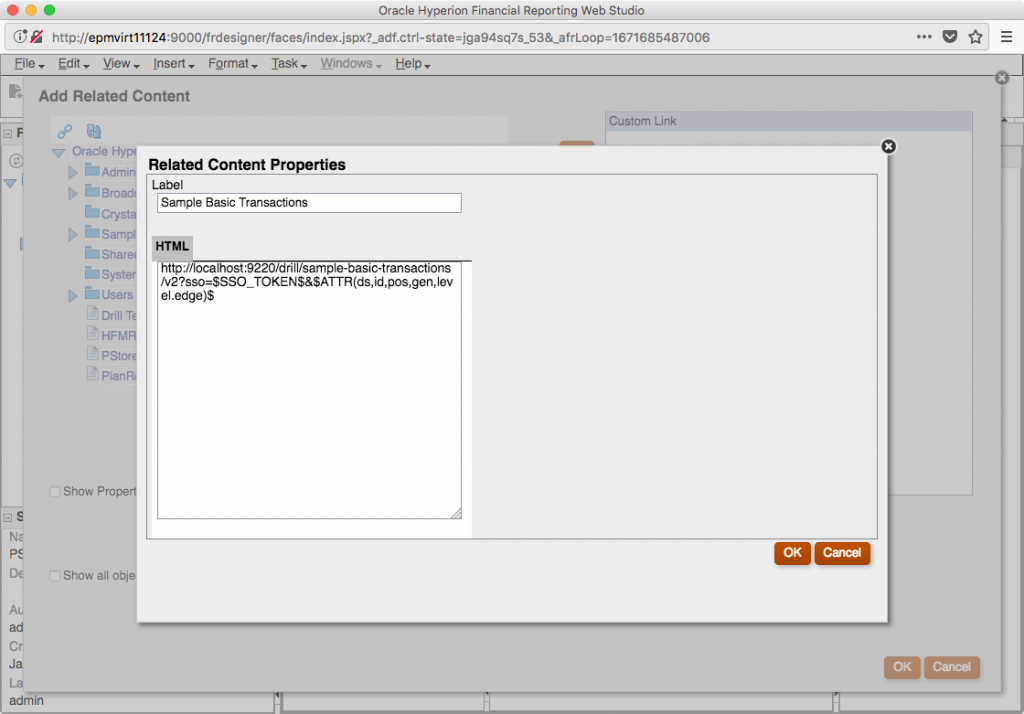
Now we can set the Drillbridge report title (it can be anything you want, it’s just the display value in FR, but you are encouraged to make it the same title as you have set for your Drillbridge definition and deployed to Essbase), and a Drillbridge URL (provided by Drillbridge, or customized by yourself):
For reference, here’s that URL:
http://localhost:9220/drill/sample-basic-transactions/v2?sso=$SSO_TOKEN$&$ATTR(ds,id,pos,gen,level.edge)$
Note: don’t use localhost in your environment. I was able to use this because I had a Drillbridge server running on my actual machine (as in my same laptop that was using Firefox to login to FR in the first place) but this should be your actual static Drillbridge server. Also, if you are incredibly eagle-eyed and a Drillbridge aficionado, you might have noticed that rather than specifying a Drillbridge report number in the URL, I’m using the new “logical alias” feature, to specify a more friendly report name of sample-basic-transactions.
This is a really killer feature in Drillbridge that I’ve covered before but I’ll go into briefly. You can give your reports an arbitrary, URL-friendly name (no spaces/special characters) and use that to launch Drillbridge reports now. You can still use the numeric ID if you want, of course. But using the logical alias makes migrations easier, and makes logs a lot easier to read through, among other things. I definitely recommend using this feature if you can.
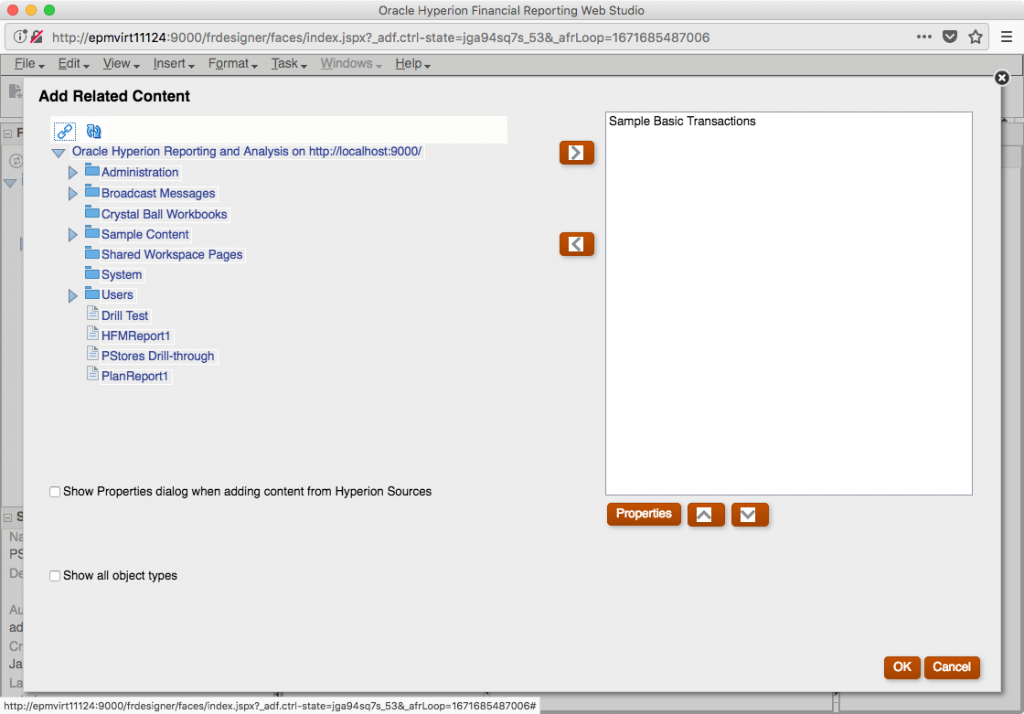
Now we can save the related content by clicking on OK. It’s now added to the list of available related content:
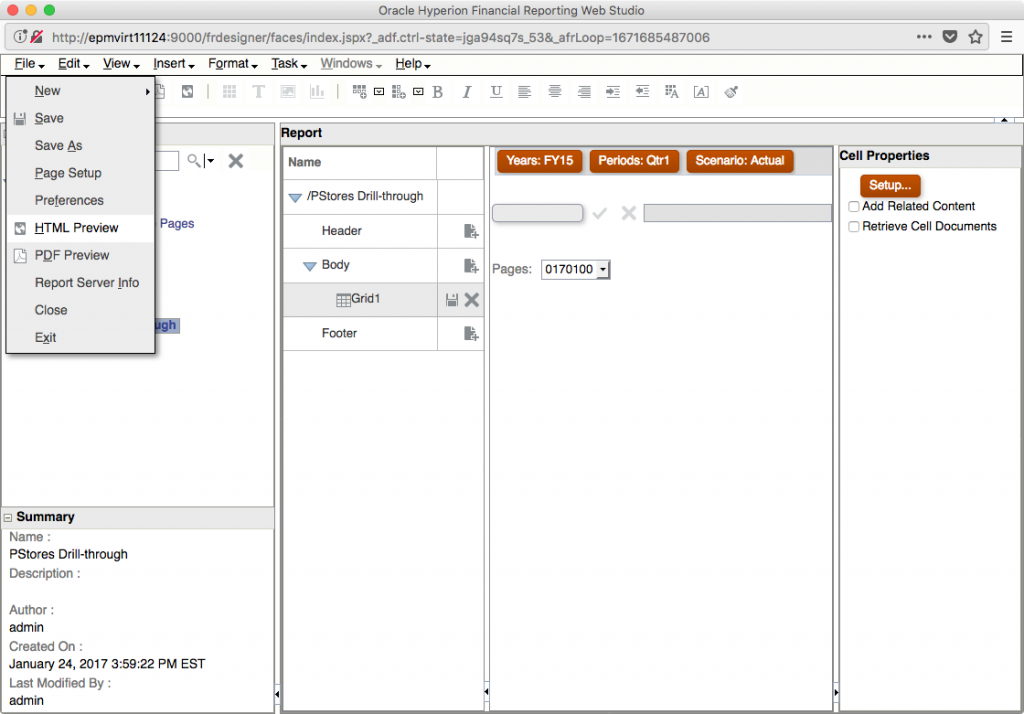
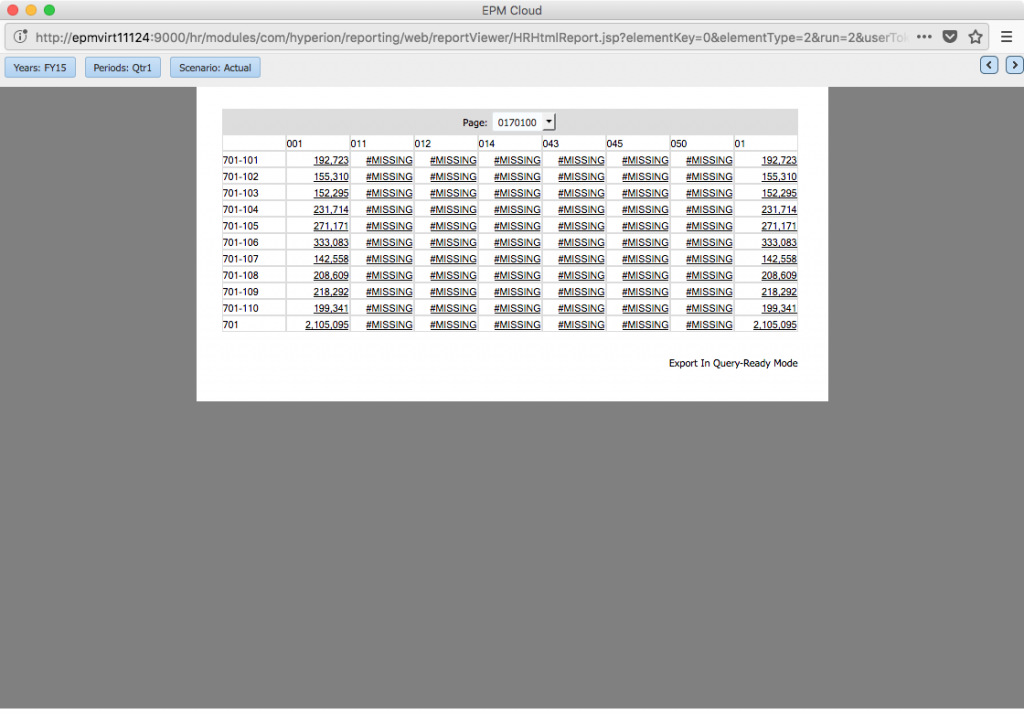
Let’s now go launch an HTML preview of the report by navigating to the File menu and selecting HTML Preview:
Giving us something like this (notice the hyperlinked data cells):
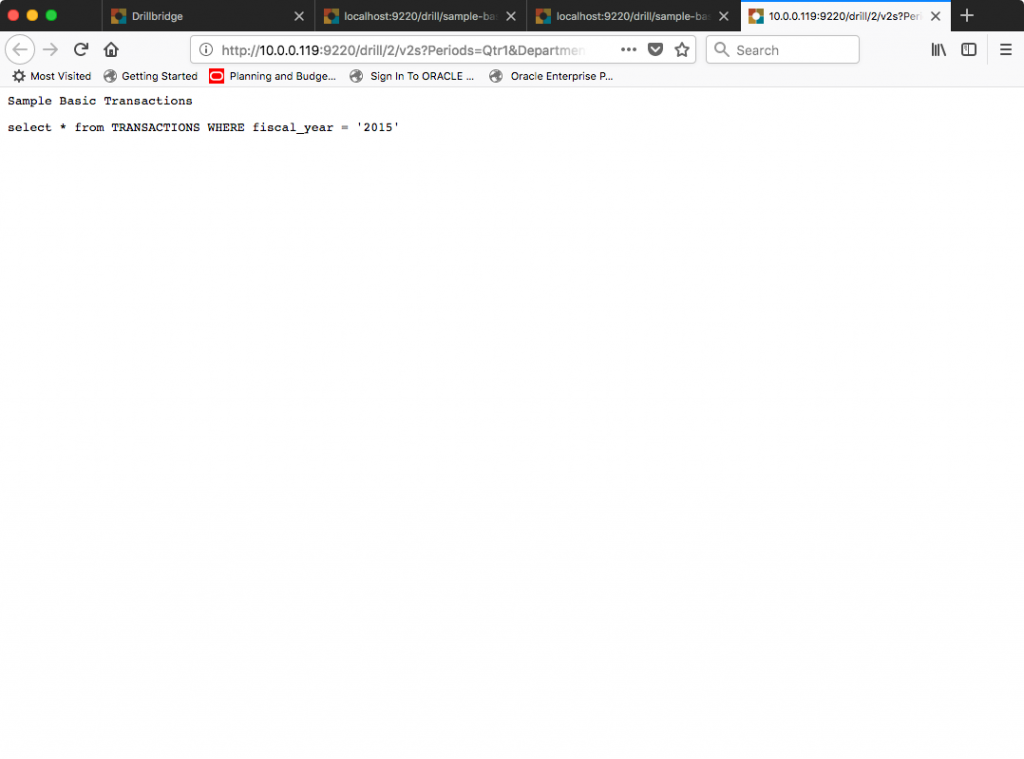
I can now click on one of the data cells to launch the Drillbridge drill-through report. For testing purposes, I have turned the Drillbridge debugging feature (link is primarily about an attribute dimension feature but also contains background on the debug feature) on for this particular report, which means that Drillbridge will just generate the SQL query and render that to the screen, without actually executing the query. This is really useful for testing and development. Let’s see what query Drillbridge generates:
This looks good. Notice that the FY15 member was translated to 2015, as per this report’s query definition (to strip the FY prefix and prepend the value of 20). I’ll now turn off debugging for this report and launch it again:
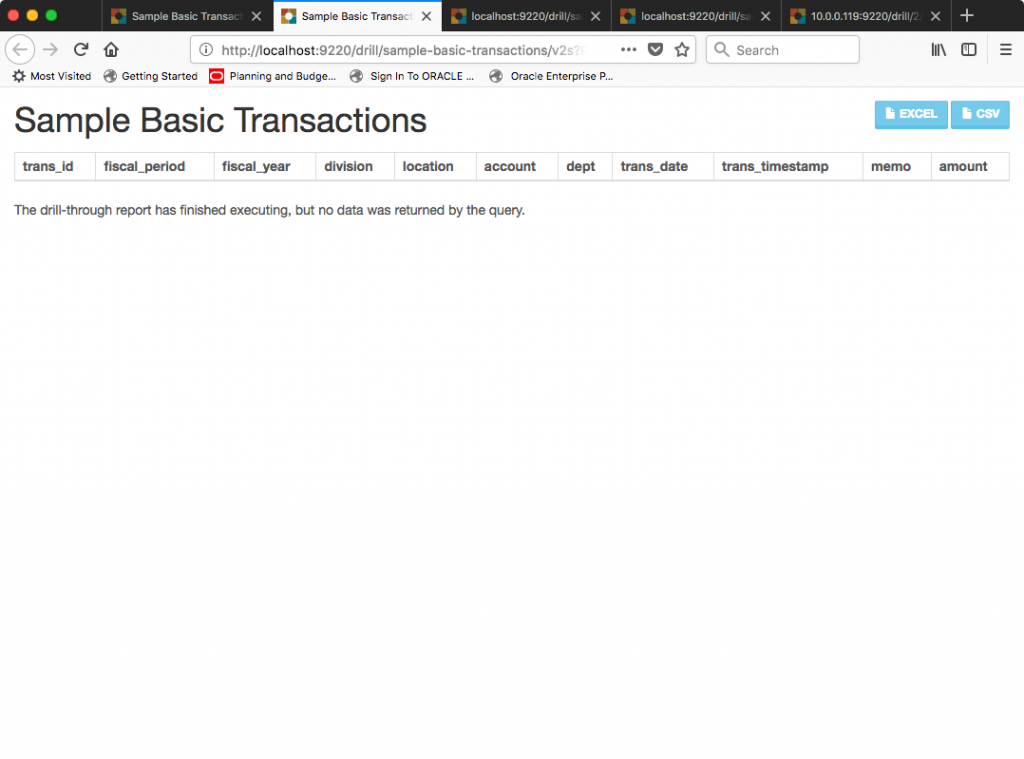
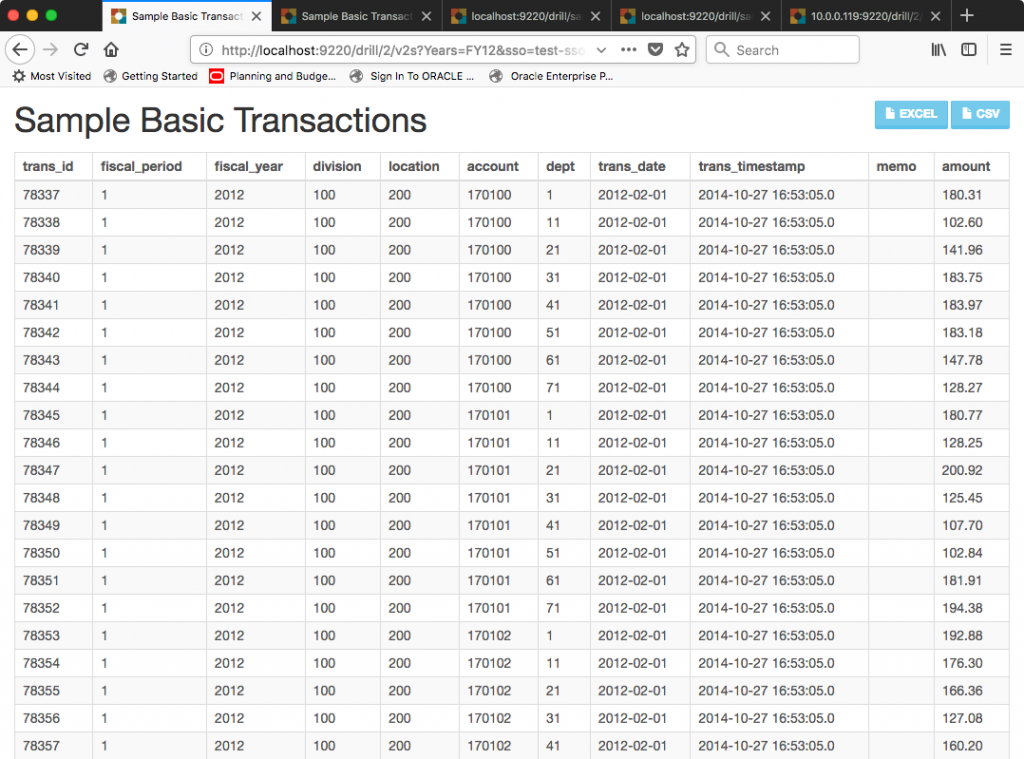
As it turns out, there is no data in my test database for this particular intersection, which is fine. Nicely enough, one of the newer refinements to Drillbridge includes some helpful text such that when the query finishes, if there was no data, Drillbridge will indicate as much. This is a small but helpful usability improvement to prevent use-cases where a user might think a long-running query is executing, but in fact there is no data). Let’s change to a different year member and launch the report one more time:
Success!
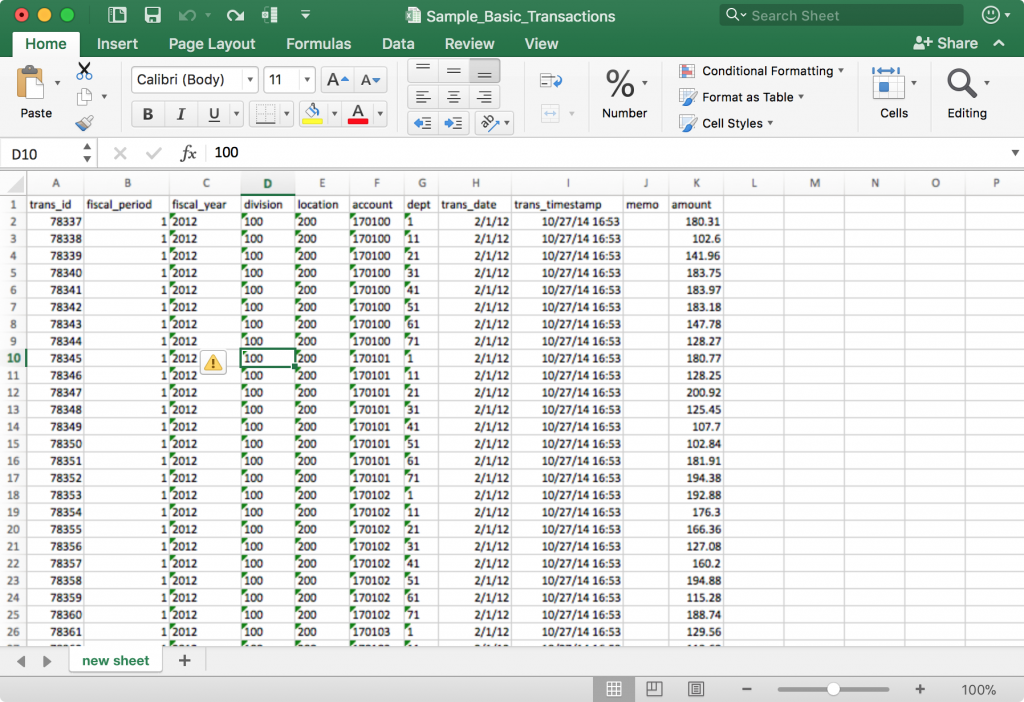
And of course, as always I can download the data to Excel with just a click:
Wrapping Up
I hope you found this article on configuring Drillbridge with Financial Reporting’s fully web-capable incarnation to be interesting. Drillbridge continues to be an incredibly useful tool for helping companies quickly enhance the value of their cubes, whether on-premise or on the cloud – please don’t hesitate to reach out to me if you have any questions.
Drilling works in Oracle EPM Workspace, but once export query-mode to SmartView (Excel), the drilling disappeared.
Issue has been resolved. Thank you!