A support request came in the other week regarding some help on how to setup a particular report. The user wanted to create a view where the first tab would be a normal “bread and butter” Dodeca view that is based on Essbase retrieval ranges (and where the data shown is based on the values of different selectors. Additionally, when the report is built, for every item on the view (in this case, different products), create a separate tab within the workbook that has transactional details for that product.
So, just to visualize this a bit more concretely, check this out:
The first tab in this workbook is just a normal everyday Dodeca view with Essbase data. Note the series of additional tabs after the first tab, though: One for each product at the bottom of the Sample/Basic database. These tabs are all generated dynamically when the report is run.
Our Chief Software Architect (hi Amy!) wound up putting together an example that showed this technique off. After I took a look at it, I knew that I wanted to show this technique off (with a couple of twists), because it shows an absolutely amazing cross-section of functionality that highlight the power and flexibility of Dodeca. Even better, this report can be accomplished without any custom programming at all. This is all out of the box functionality that neatly ties together the ability to retrieve Essbase data, relational data, cascaded tabs, hidden selectors, Excel formatting, and more.
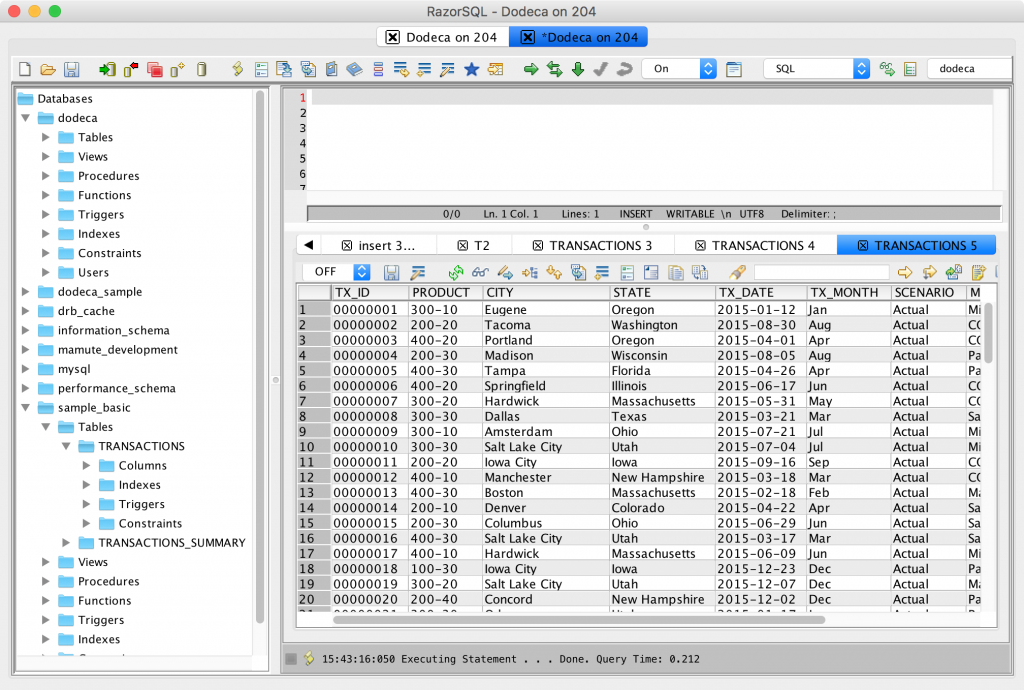
In this post, I’m going to walk through how I went about setting the report up, although I’m going to gloss over the nitty gritty on some of the techniques I’ve covered before (but will provide links to the relevant articles when I do so). So, first thing’s first, i want to introduce you to my sample data. This is a simple data set that I use all the time (hello drill-through!). It models some fake transactional data for the Sample/Basic cube:
You may notice the addition of certain fields not present in the Sample/Basic cube, such as a transaction ID, city, transaction data, and an account number (not pictured). This data represents the data we are going to want to show on the dynamically generated tabs in our report. In this case, we’re going to be filtering the data based on the product.
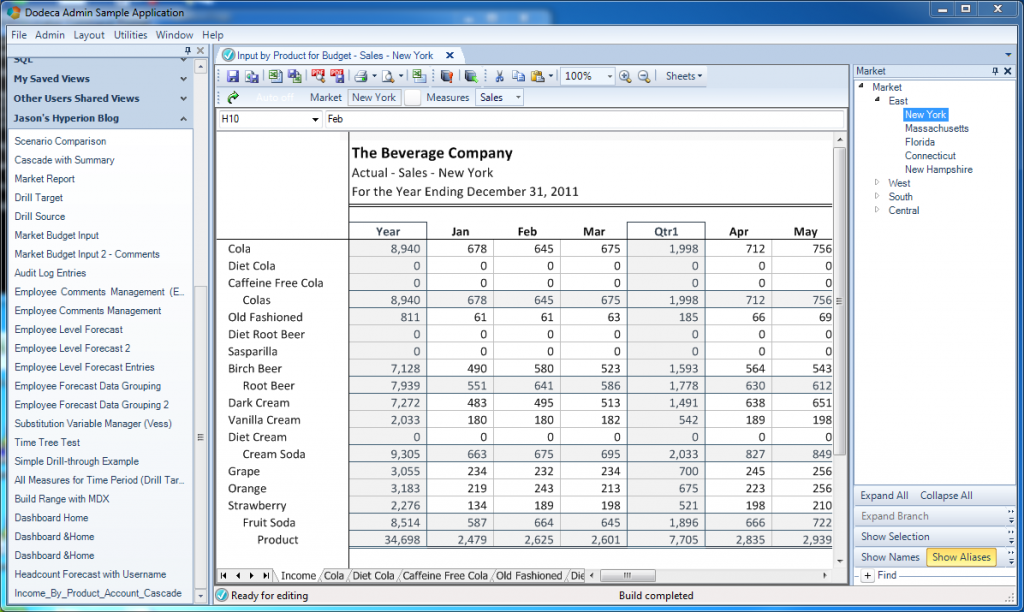
Also to provide some context for where this design process is headed, I want to show what the final report looks like, or at least, the main tab on the final report:
Again, the layout of our report will be that we have Essbase-based data on the main tab, and also that the user is able to choose a given Market (pictured is New York) and measure (pictured: Sales) to build this main retrieve and the dynamically generated tabs. So our job now is to build this Dodeca view and template.
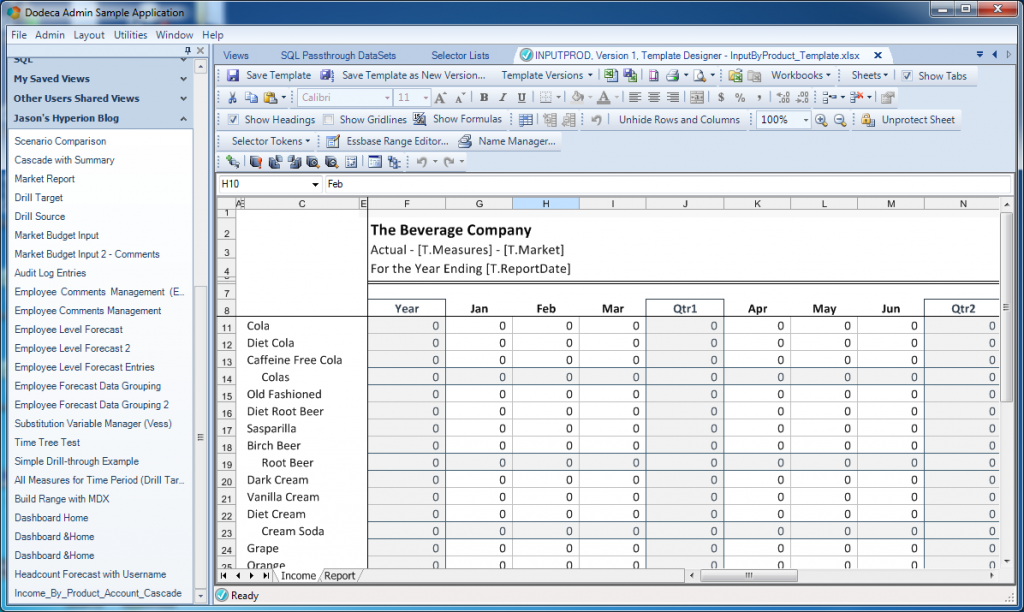
Let’s take a look at how the Excel template for this view is setup. First, we have the Income tab, which is based around an Essbase retrieve:
Again, the user will be able to choose the measure and market that they want, although in this case, the list of products is just hard-coded. As I’ve shown before, the grid of data is a named range that Dodeca will automatically retrieve from the view’s associated Essbase connection when the view is built. If you’re interested, you should have a look at how to setup an Essbase-based retrieve range report in Dodeca for some background.
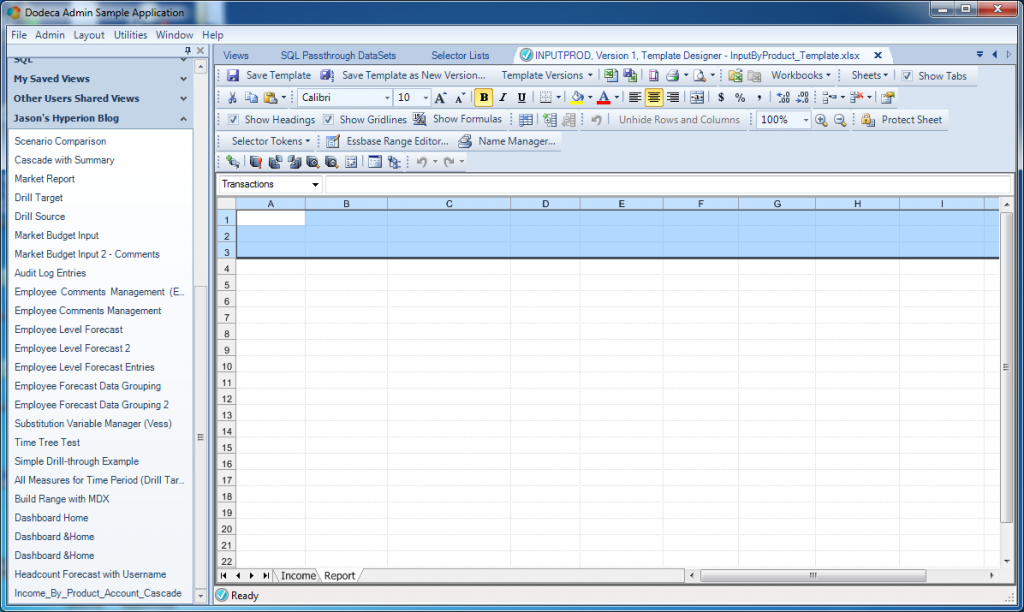
Let’s jump over to that second tab (Report) and take a look at things:
This is a pretty spartan layout, but it gets the job done. As I’ve also shown before, we have a named range (in this case named Transactions) that will serve as the insertion area for some relational data. We have 10 columns (one for reach column we bring back in the SQL query). The reason the range is three rows tall is because we are going to bring back headers from the SQL query (check out some of my previous articles for details on the nuances of building views based on relational retrievals).
Check out one of my earlier articles on relational data-based Dodeca reports for more background on these are setup and work. You can also check out a post on cascading reports in Dodeca for some background on those as well.
It’s important to note at this point that the Report tab is the tab that’s going to serve as the basis for our cascade. We’re going to configure this view such that for each different product in the cascade, it’s going to execute the SQL query we’re going to setup, plug in the current product, add the results, name the tab, then insert a new tab for each subsequent product. We’re going to achieve all of that behavior just by configuring our selector and view properties, and not have to do any custom programming or manually define tabs or anything (woohoo!).
As a brief aside, one thing I want to point out is that typically I’ve shown examples in the past where we had just one tab we really cared about for a given report. But there’s really nothing stopping us from putting in multiple tabs, and as part of the view building process, Dodeca just iterates through them all and builds them accordingly. This is really great, especially if we want to generate books with very disparate layouts and other things.
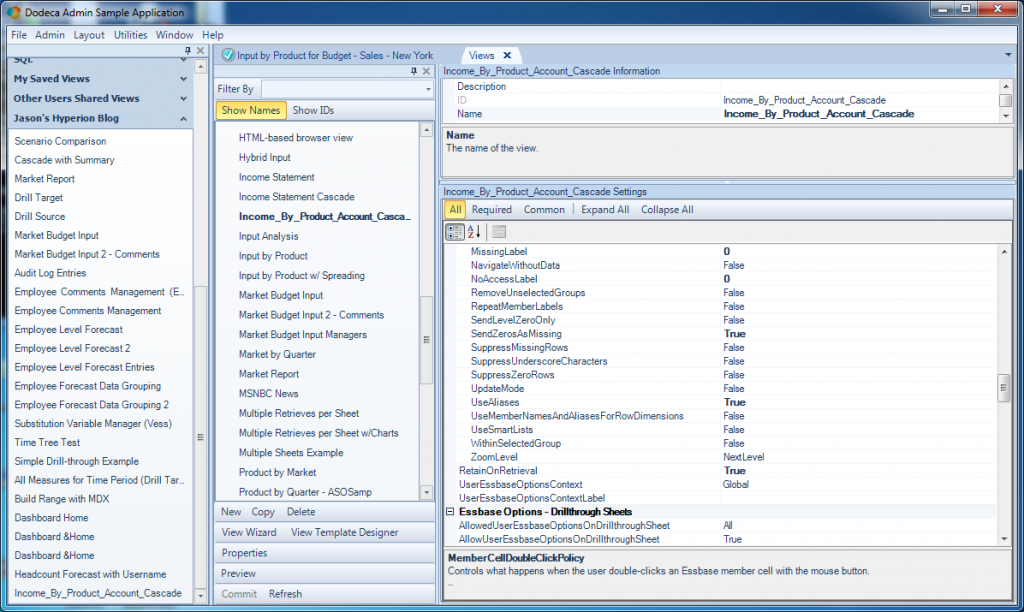
With our template mostly squared away, let’s take a look at the configuration of the view itself now. First of all, the view type here is an Essbase Excel view. This is the view type typically used for containing data based on retrieves from Essbase – but don’t let the name fool you. This view type also completely handles relational retrievals in addition to those from Essbase.
The real crux of this report is the configuration of the Cascade settings. I’ve shown the power of the Cascade options before, but there are a couple of nuances here that are incredibly powerful and useful for our purposes:
First of all, cascading is turned on of course (CascadeDoCascade = True). We have one source defined in our CascadeSources. This is the Product selector. While the report itself has three selectors (Market, Measure, Product), for the purposes of cascading we get to choose the selectors that will actually participate towards the different permutations that are generated. In this case, it’s only Product.
Next, we get to choose a pattern for how the name of a given dynamically generated cascade sheet (tab) is determined. This is where things get a little interesting. If you go back and look at the data in my transactional model, you’ll notice that the product names are raw member names (such as 300-10), rather than the alias (“Cola”). So I have kind of this mismatch: I want to use the member name to filter the query, but I want to show the alias in the tab. I can easily accomplish this (no code!) by referring to a special token called [T.Alias.1]. The suffix of this token (the “.1”) an index for a given cascade selector, starting with one. In other words, if I had two selectors participating in the cascade, and I wanted to refer to the alias of the current member in the second selector, I’d use the token [T.Alias.2].
Lastly, notice the CascadeTemplateSheetNumber parameter, set to 1. The first sheet in the workbook has an index of 0, and the second has an index of 1. What we’re effectively specifying with this parameter is the sheet to use (the second tab) as the basis of the cascade. It’s a small option that we probably won’t use too terribly often in practice, but it is incredibly useful here.
Moving further down the list of view options, things are mostly set to defaults, although I want to point out that UseAliases is set to True. This is a fairly standard option to have on (since when the Essbase retrieves are performed, we want them to contain aliases instead of member names). As I’ll show later, this actually effects our Essbase selector a little bit, so just keep that in mind for now.
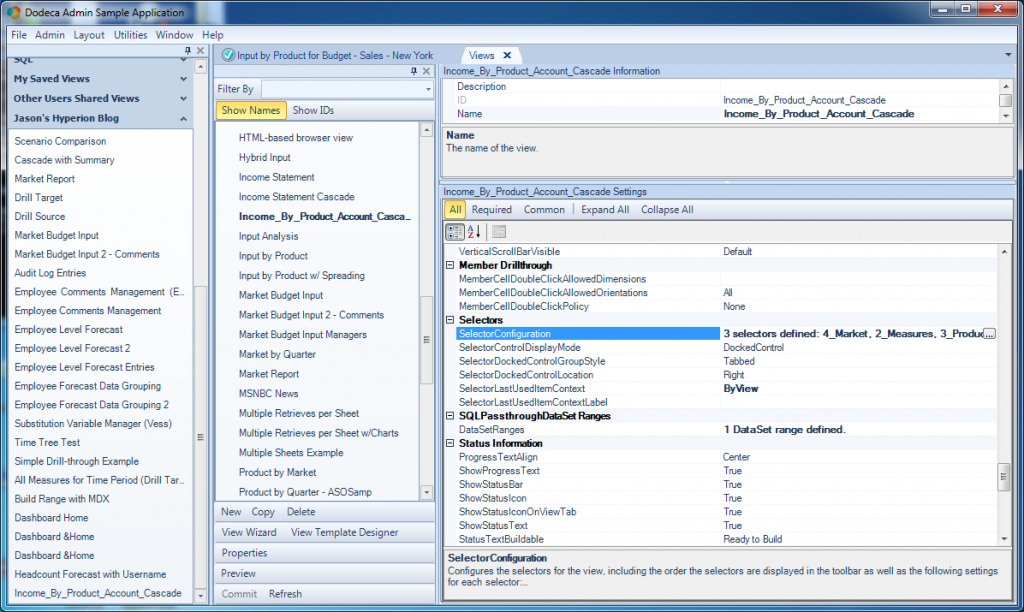
To round out the view configuration, just notice that we have three selectors (two will be shown to the user, the last is hidden and used under the hood), and there is 1 DataSet range defined. The DataSet range is used to marry up the relational data and populate it into a given named range on one of our worksheets. In our case, it’s that range named Transactions that I showed earlier – on the same sheet that forms the basis of the cascaded sheets.
Let’s actually take a closer look at the SelectorConfiguration:
In Dodeca, the selector more or less corresponds to a given dimension. The Selector List object closely related but a little different. The selector list chosen for a given selector represents the exact items and UI for displaying them that will be available to a user.
For example, our report contains a selector for Products. We might then choose from one of multiple corresponding selector lists for that selector that have different properties. For example, one might just show a flat list with all the level-0 members of the Product dimension. One might show a hierarchical tree of values including parents. And yet another might be a hierarchical tree where we can select multiple items, but can’t choose anything that is higher than level-0. We have a lot of flexibility. Along those lines, while the selector lists in play for this report for the Market and Measures are straightforward (normal lists where the user chooses a single value), we have something a little different going on for this Product selector.
You see, we can generate the items available in a selector list however we want: from a hard-coded list of values, dynamically based on a report script, from SQL, and even other ways. For purposes of this report, we want the contents of the Product selector to be all of the level-0 members of the Product dimension – but we don’t want to type all of those things in manually. Further, for this selector list we want it to be totally hidden from the user. The reason we are doing this is that we want the selector to be populated with values from the Product dimension, and then when the report runs, those values (because they are part of the cascade sources) will be used to generate the permutations of sheets such as Cola, Diet Cola, and so on.
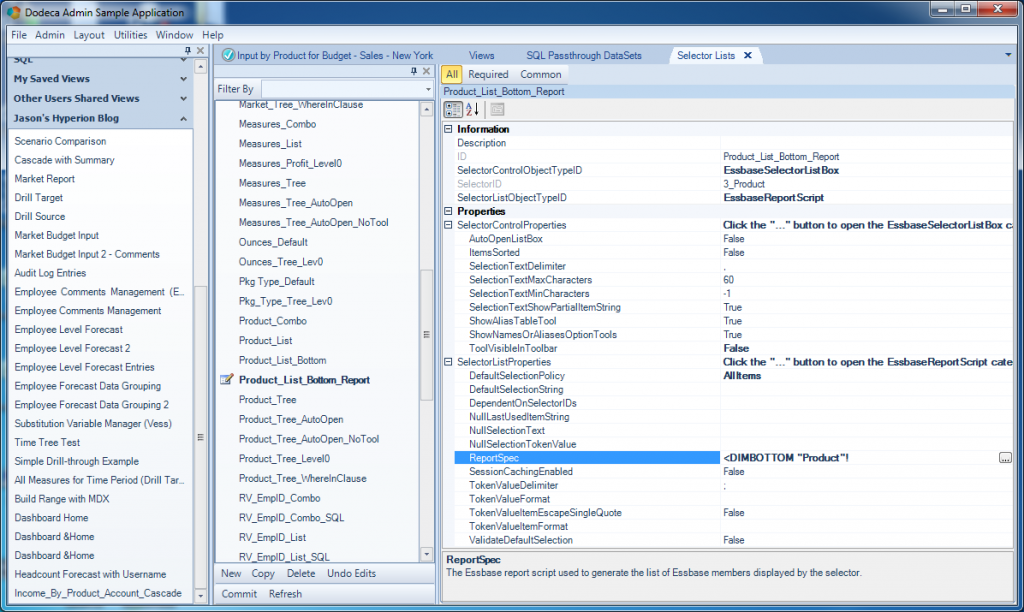
The specific selector list for Product is one that I designed for just this report, called Product_List_Bottom_Report. Of note for this selector configuration (but not pictured in the above screenshot, is that the selection policy is set to Multiple, meaning that we’re allowed to select multiple things from it). Let’s open up this selector list:
This type of selector list (EssbaseReportScript) is a selector whose contents are generated dynamically based on an Essbase report script. The report script code is simple here: <DIMBOTTOM "Product"! – meaning that the items in the list are the bottom level (level-0) items underneath the member/dimension “Product”.
This selector list has some interesting and powerful properties set. Most notably, we have ToolVisibleInToolbar and DefaultSelectionPolicy. With ToolVisibleInToolbar set to False, it means that this selector list won’t have a UI component in the view (hidden from user) – but it’ll still be totally functional for our purposes. Next, with DefaultSelectionPolicy set to AllItems, every item in the generated list will automatically start off being selected (in UI terms, if it were visible it’d have its corresponding checkbox checked). You could call this the “Hidden Selector” technique where we want to generate certain member names and have them be useable for purposes of using as part of a cascade or our report.
Excel Formatting FTW
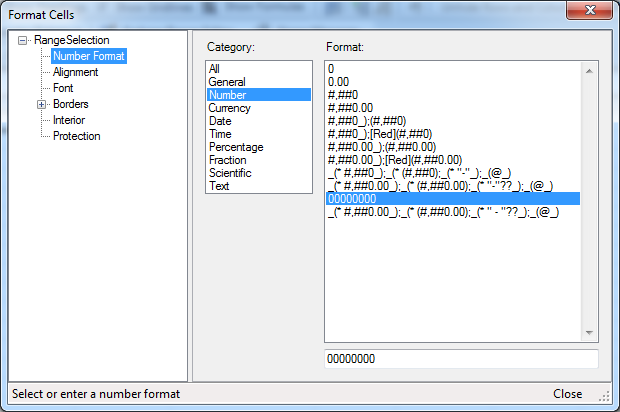
I visit this topic often, but it’s for good reason: one of the great things about Dodeca is that users and developers get to leverage a ton of existing Excel knowledge to increase their productivity and shorten their learning curve. This is true of formulae, formatting, and more. In the transaction details sample data I have, there is a TX_ID that is numeric but stored in a CHAR(8) column. Without specific formatting to display this, Excel by default would just not show the zeros, but I actually want them to show. So, a little Excel formatting to the rescue:
A custom format of 00000000 tells Excel to format the number and show all leading zeroes. I also wound up applying the Date format to the date columns so they’d show properly instead of a number showing (Excel thinks of dates in terms of numbers rather than some arbitrary text).
Recap
We covered a lot of ground here, so let’s do a quick recap. We want a report where the user can select a measure and market, hit the build button, then generate a report where the first tab is the data from Essbase, followed by a dynamically generated set of tabs with transaction detail. The first tab in this report is a a very typical Dodeca report – an Essbase retrieve range and a couple of selectors. The second aspect of this report (the other tabs), is also fairly typical, although it’s a little special here for a couple of reasons. We added an additional selector to the view so that we could use it as the basis of generating tabs in the cascade, but what was a little different this time around is that he hid the selector list from the user and automatically selected everything in it. As an additional twist to the report, we used some of the additional cascade settings to tell Dodeca to build the cascade starting with the second tab, and then used a special token to put a “nice name” (the member alias) in for the tab name, rather than the raw member name.
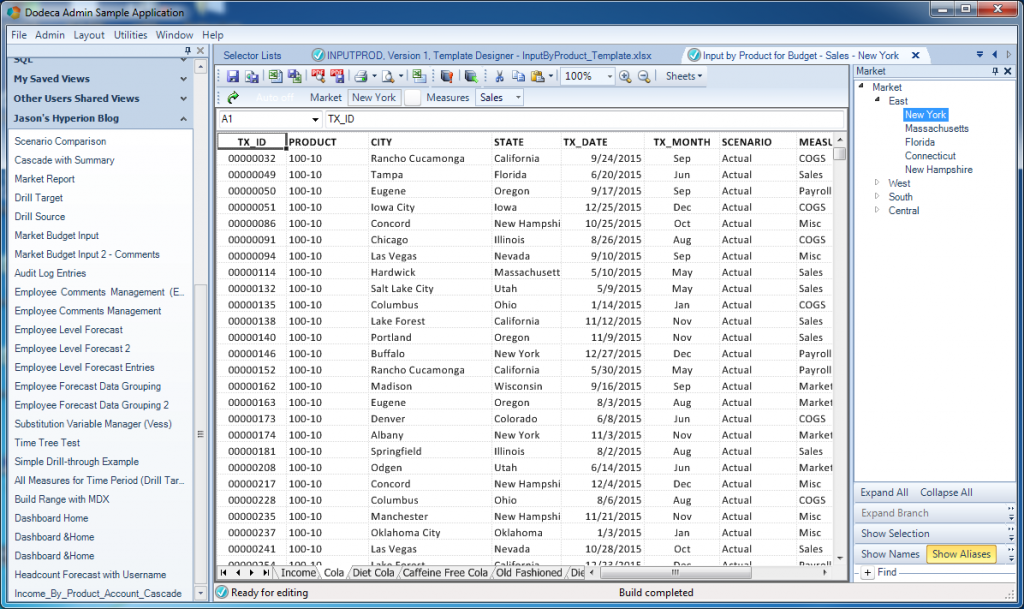
Now to come full circle, here is the final result in all its glory (one of the generated transaction tabs):
I hope you enjoyed this technique, since I think it’s a really great one, and amazing what we can achieve with a little bit of creativity and configuration, but without having to write any code (not that there’s anything wrong with that). I’ve seen some classic VBA solutions that achieve similar levels of functionality but they have a fair bit of code to connect, perform operations, and all that stuff. And yet here we can do it all pretty seamlessly with out of the box functionality.
