Continuing on in this weeks blog series and lead up to Kscope16, I’m going to show off one of the fundamental concepts in Dodeca with regard to building reports: multiple retrievals in the same sheet. This is a core feature of Dodeca that has been around since its earliest days.
I would guess that the vast majority of spreadsheets built to retrieve Essbase data are just a single retrieve. But quite frequently we want to have a sheet with data from multiple retrieval ranges on it. These other retrieval ranges might be from the same database/cube or from another data source. In a pure Excel environment, the process of updating a sheet with multiple retrieval ranges is straightforward, if a bit tedious: select the first retrieval range, retrieve it, select the second, retrieve it, and so on.
For one or two retrieves, this isn’t so bad. But for a report that is regularly run, has some formatting, and possibly some other tweaks needed, the effort becomes a bit tedious (and time consuming).
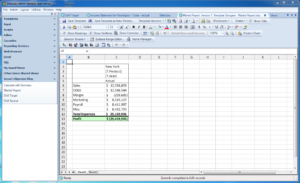
This is where Dodeca’s support for multiple retrieves come into play. We can configure a sheet with absolutely any Excel formatting we want and an arbitrary number of retrieval ranges. For example, consider our good ole friend Sample/Basic. We’d like to setup a report that shows measures for a given product and year for various markets. We can setup a simple Dodeca template like this:
There’s nothing too fancy just yet. Take note of how the Year (time period) and Product are tokenized with [T.Product] and [T.Year]. As with before, this means that the selection(s) from the user will be plugged in for these tokens and then a normal Essbase retrieve will be performed.
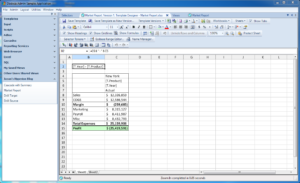
The plan here is that we’re going to actually have multiple boxes like this on our sheet for all sorts of different markets. That said, we don’t really need to show the time period and product in every single box, since they will be the same for each box on the sheet. So it’s a good candidate to show at the top of the page. So let’s do that:
Note the formula in cell B2: it’s referencing cells C6 and C5. Sometimes Dodeca forces us to think temporally with regard to how we construct our spreadsheets: during template development, we just see the token names. But remember, when the sheet gets built, the token will be replaced with the value of the selector (in this case), and the value shown in our title will update because it’s dynamic. This is an incredibly foundational element in Dodeca templates. We can use any Excel formula too: so if we need to trim a string, concatenate, or whatever, that’s all in our toolbox.
As a quick aside, things like this (with formulas) tend to be one of the reasons that Dodeca resonates so strongly with users and power users in finance at various organizations: because an incredible amount of existing Excel knowledge is directly applicable and useful. It shortens the learning curve. A lot.
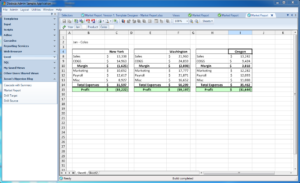
Now that we have a basic format our our “measures box” that we like, we can simply copy and paste it to create additional boxes with a fixed market. Remember, while the user can choose the product and time period for this report, we’re going to give them a fixed list of markets for now. As you can see in the screenshot, I have updated the Market to Oregon and Washington in the new boxes. Additionally, I have hidden the time period and product from each box (since the boxes are all aligned I just wound up hiding two rows and that affected each box). Even though the rows are hidden, they will still be part of the retrieval range. Speaking of retrieval ranges, we have three of them now: named ranges that correspond to the retrieval to be performed for each data box.
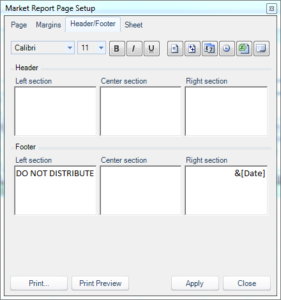
Just for fun, and to continue on with the theme of “your Excel knowledge is applicable and useful”, let’s adjust the page footer a little bit, using the common page header/footer editing dialog box, and place in the current date in the lower right corner and a note about confidentiality in the lower left:
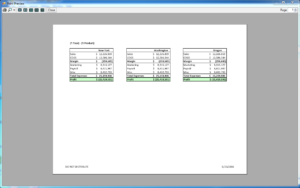
Lastly, I’ll adjust the print range, page orientation, and do a print preview to see what this report is going to look like when it’s printed out:
Not shown here, but I also went into the options and turned off row/column headers and gridlines to clean the appearance of the report up a little bit. These are just easily toggled with a simple option. Everything is looking good. Now let’s run the view, select a product and time period, and build it:
And there we have it: a nicely formatted report that users can build with any product and time period, at the click of a button, and get nice print-quality output if they want a hardcopy. I want to recap some of the fun things going on here:
- Multiple retrieval ranges: use the infinite flexibility of Excel to arrange data exactly how you want it, not some arbitrarily limited data arrangement
- Use Excel formulas (and our existing Excel knowledge) to format the report exactly how we want, dynamically
- Instantly build at the press of a button: no connections, selections, individual retrievals, row hiding, or formatting to deal with
- Printer-ready output if we want a hard copy
- No off-by-one errors or other innocent mistakes involved in the process of generating the report: get the right data, every time
In the coming weeks I’ll show off some more advanced examples that combine multiple data sources, multiple types of data sources (SQL data anyone?), and more. Stay tuned and don’t forget to swing by the Applied OLAP booth at Kscope and say hello!

Jason as you can define multiple retrieve ranges (Ess.Retrieve.Range.x), can you as well define specific submit ranges that won’t be overwritten?
This is a feature we implemented time ago in our custom add-in which allows users to define multiple retrieve or submit ranges.
Yes, you can absolutely have multiple send ranges. Maybe that will be the topic of my next blog post. :) Feel free to email i you have an additional question on it.
[…] Multiple Retrieves in Dodeca […]